Fig. 5
Download original image
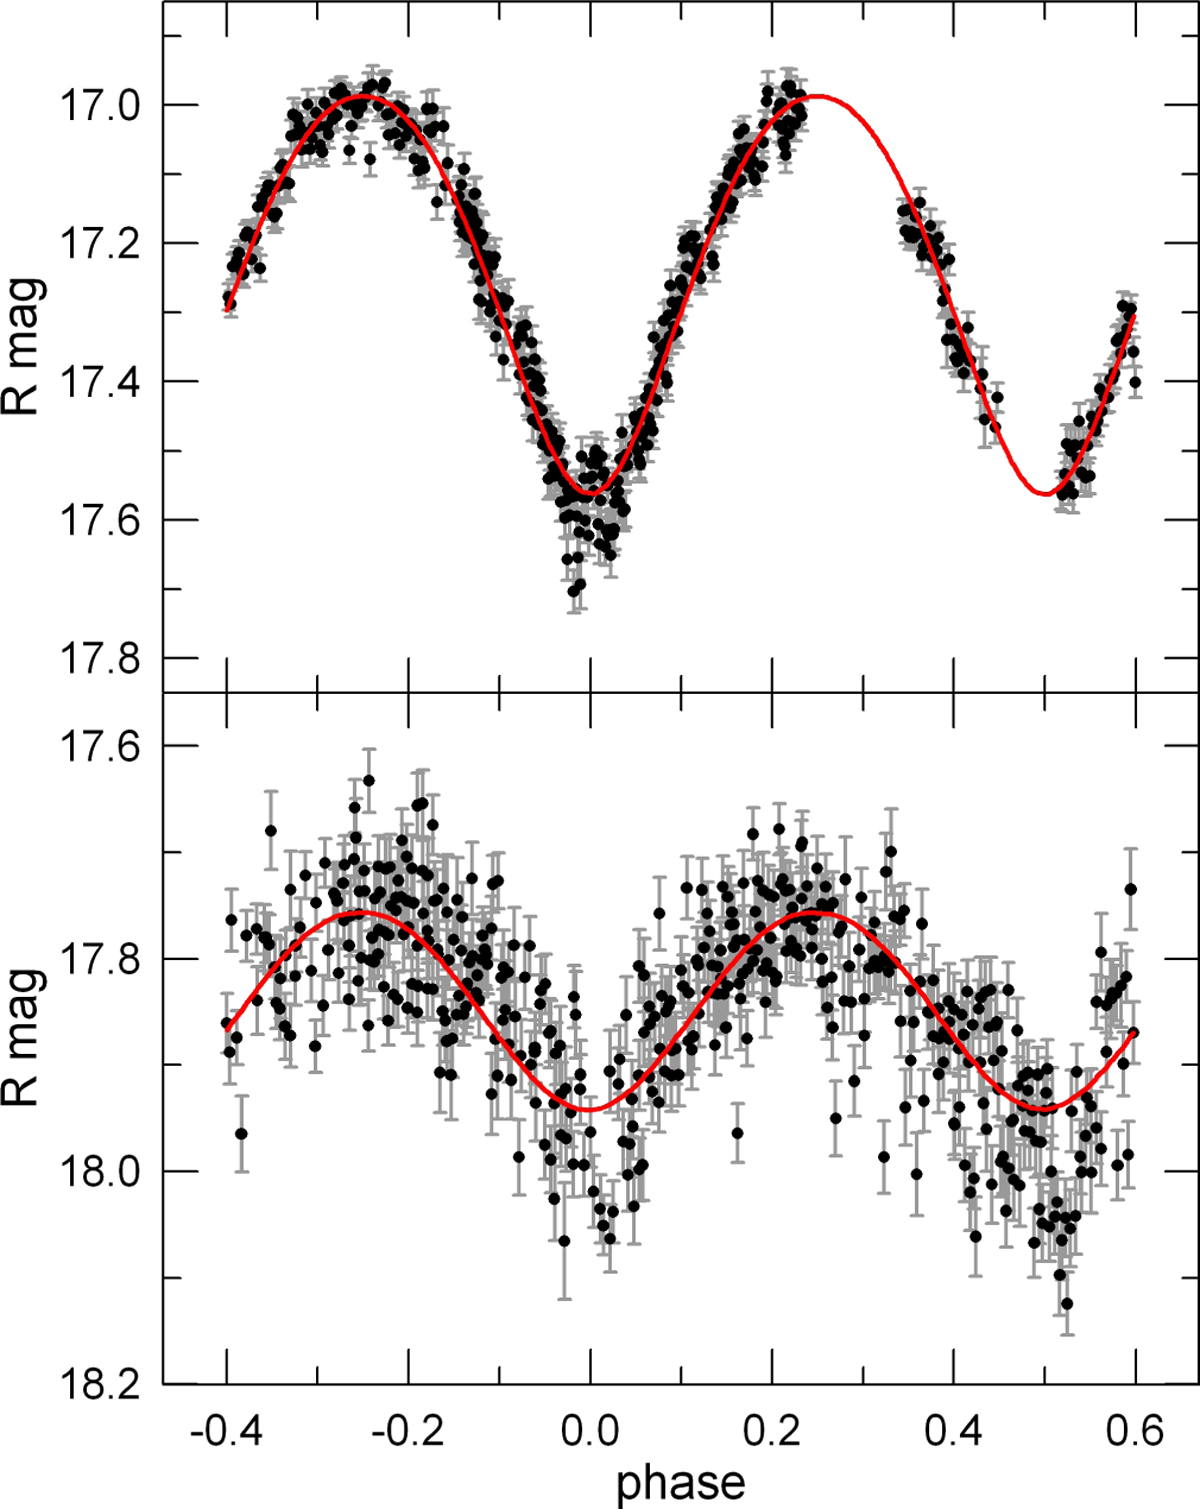
Result of separation of the light curve into two components produced by the slowly (top panel) and rapidly (bottom panel) rotating fragments of 288P, respectively. The best fitted model curves (red lines) computed for the first case in Table 2 are also presented. Both curves were phased according to the appropriate sidereal periods.
Current usage metrics show cumulative count of Article Views (full-text article views including HTML views, PDF and ePub downloads, according to the available data) and Abstracts Views on Vision4Press platform.
Data correspond to usage on the plateform after 2015. The current usage metrics is available 48-96 hours after online publication and is updated daily on week days.
Initial download of the metrics may take a while.