Fig. 6
Download original image
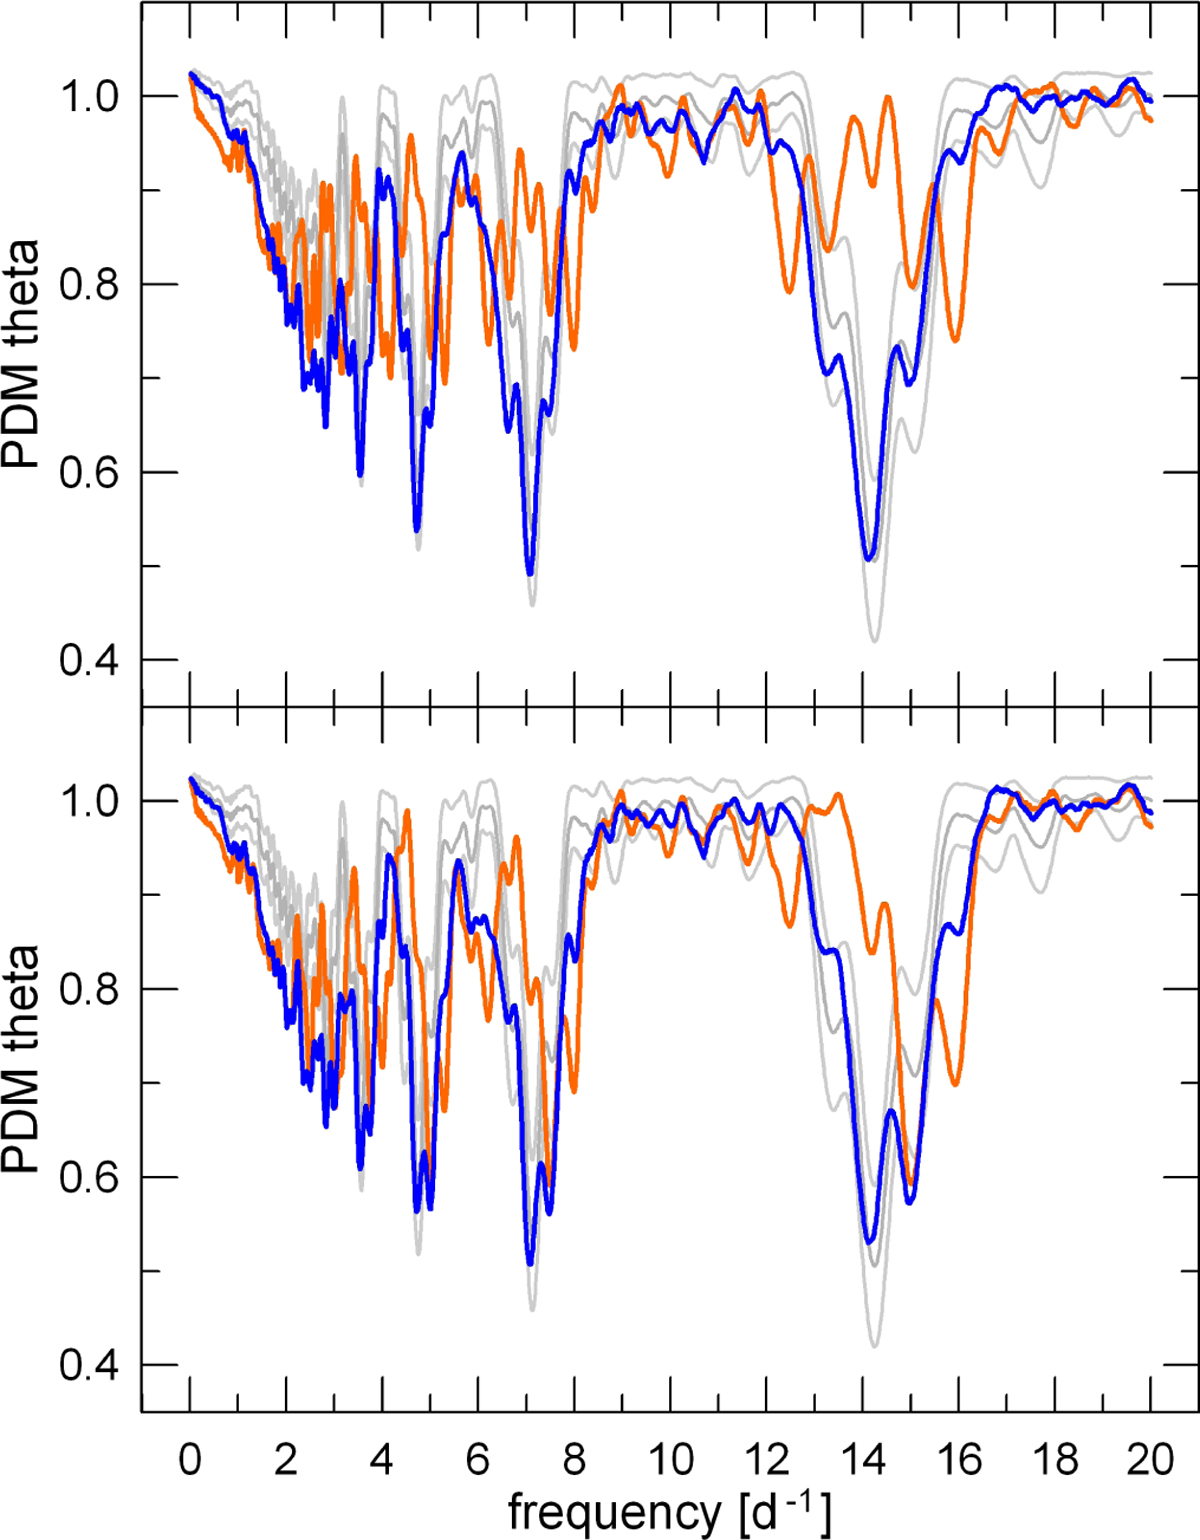
Result of the PDM periodicity search for the test light curves. These curves are the superpositions of variability with a period of 3.6 h for B and 3.2 h for C, and for the ratio of the amplitude of B variability to the amplitude of C variability equal to 1.0 (top panel) and 0.5 (bottom panel), respectively. These periodograms are compared with the bound periodogram (grey lines) that is represented by the mean and the +/− 3σ limits in the case of our observations (for details see the text). The blue and orange lines are for phasing of the composite light curves that gives the best and worst compatibility between the observed and the test periodograms.
Current usage metrics show cumulative count of Article Views (full-text article views including HTML views, PDF and ePub downloads, according to the available data) and Abstracts Views on Vision4Press platform.
Data correspond to usage on the plateform after 2015. The current usage metrics is available 48-96 hours after online publication and is updated daily on week days.
Initial download of the metrics may take a while.