Fig. 8
Download original image
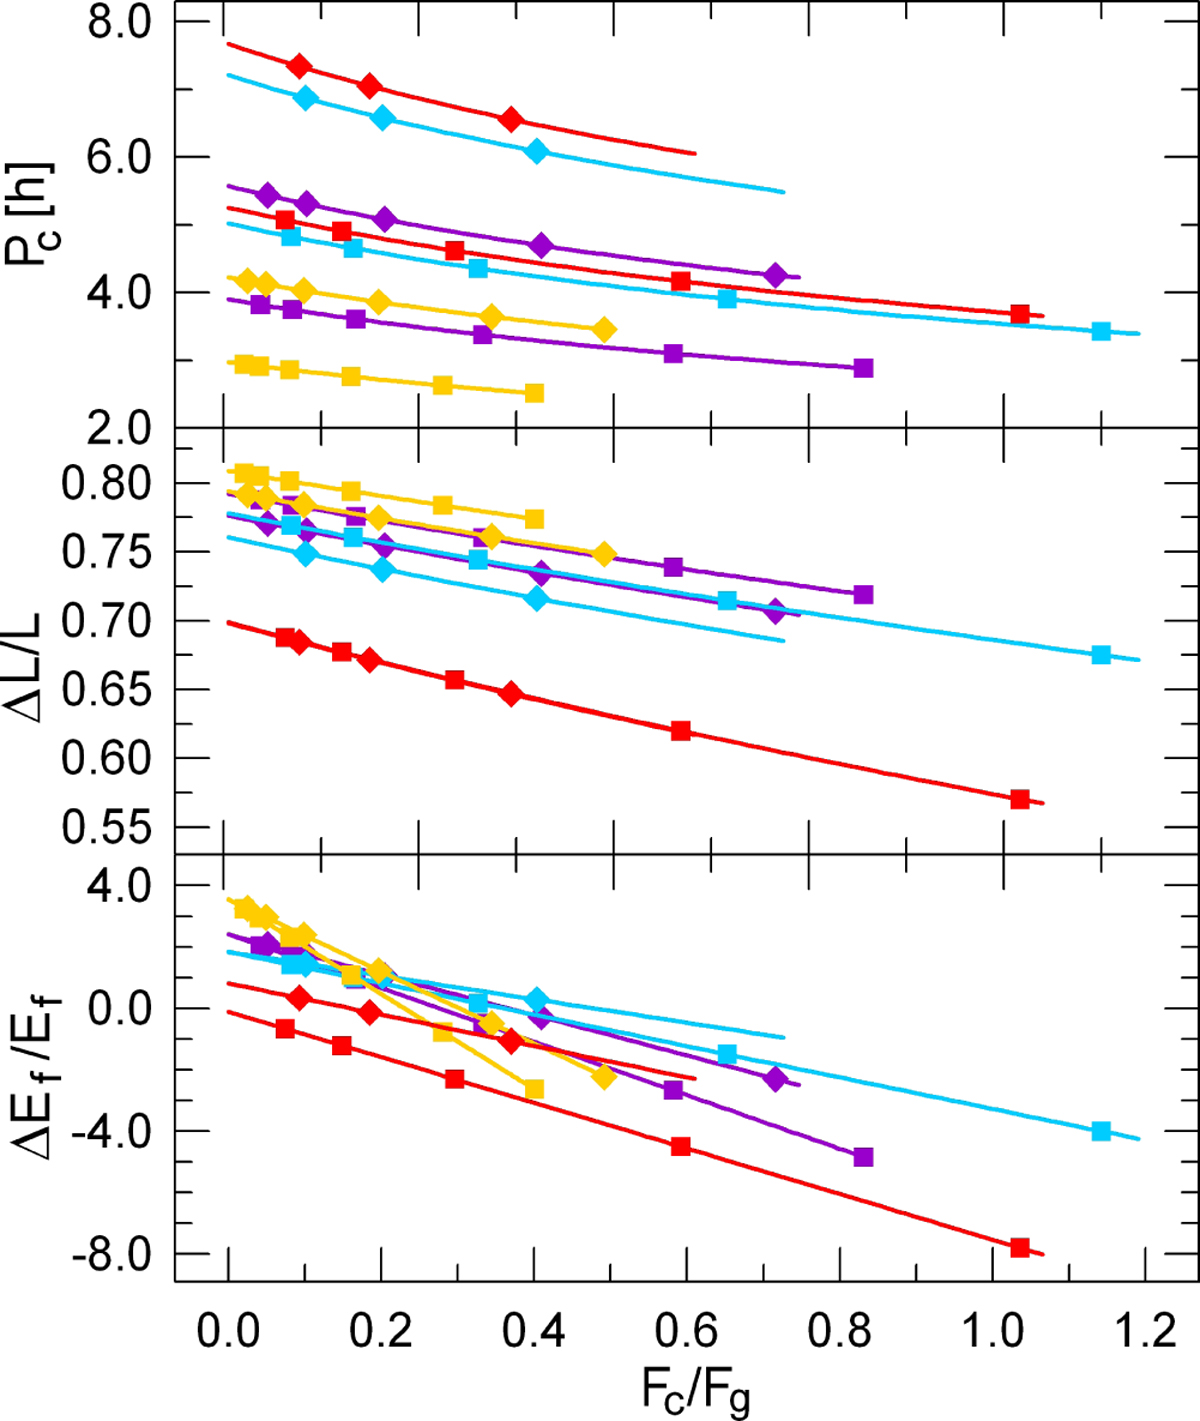
Dependence of the critical rotation period Pc (top panel), relative increase in total angular momentum ∆L/L (middle panel), and free energy ∆Ef /Ef (bottom panel) on the ratio of the cohesive force Fc to gravity force Fg. Both gains are related to the current values of the quantities. The lines end at the ratio value for which the orbital energy of the system becomes positive after fission. The violet, blue, and yellow lines indicate AR equal to 0.07, 0.05, and 0.10 (cases 1, 2, and 3 in Table 2) whereas the red line is for case 6. Diamonds show the initial lobe configuration TA − TB and squares mean SA − SB merger. Symbols are placed where values of the cohesive to gravity force ratio correspond to the cohesive strength of 50, 100, 200, 400, 700, and 1000 Pa for the assumed value of the neck cross-sectional area.
Current usage metrics show cumulative count of Article Views (full-text article views including HTML views, PDF and ePub downloads, according to the available data) and Abstracts Views on Vision4Press platform.
Data correspond to usage on the plateform after 2015. The current usage metrics is available 48-96 hours after online publication and is updated daily on week days.
Initial download of the metrics may take a while.