Fig. 1.
Download original image
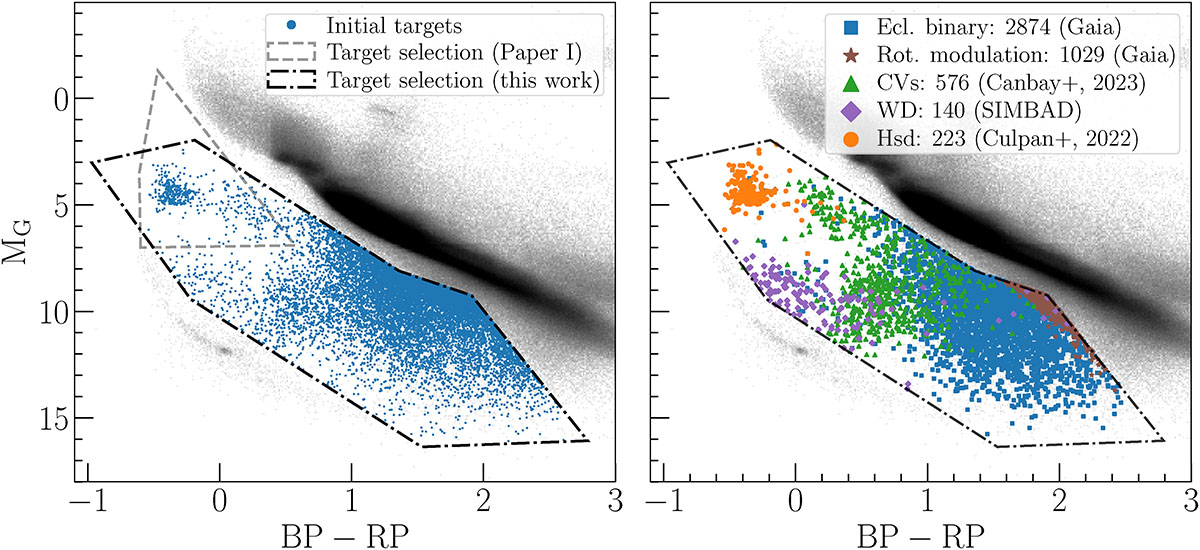
Colour-magnitude diagrams, with grey background points representing all selected Gaia DR3 sources within 1 kpc. Left panel: Blue points showing the 18 085 initial targets drawn from the grey background sources within the dash-dotted black polygon. The dashed grey polygon marks the region from which the targets in Paper I were selected. Right panel: Identified stellar classes among the 13 405 final targets within the same dash-dotted black polygon, namely hot subdwarfs from Paper I (orange circles), eclipsing binaries from Gaia classification (blue squares), solar-like rotational modulation stars from Gaia classification (brown stars), CVs from Canbay et al. (2023) catalogue (green triangles), and white dwarfs from the SIMBAD database (purple diamonds), and hot subdwarfs from Culpan et al. (2022) catalogue. The dashed grey polygon indicates the freely selected target region.
Current usage metrics show cumulative count of Article Views (full-text article views including HTML views, PDF and ePub downloads, according to the available data) and Abstracts Views on Vision4Press platform.
Data correspond to usage on the plateform after 2015. The current usage metrics is available 48-96 hours after online publication and is updated daily on week days.
Initial download of the metrics may take a while.