Fig. 2.
Download original image
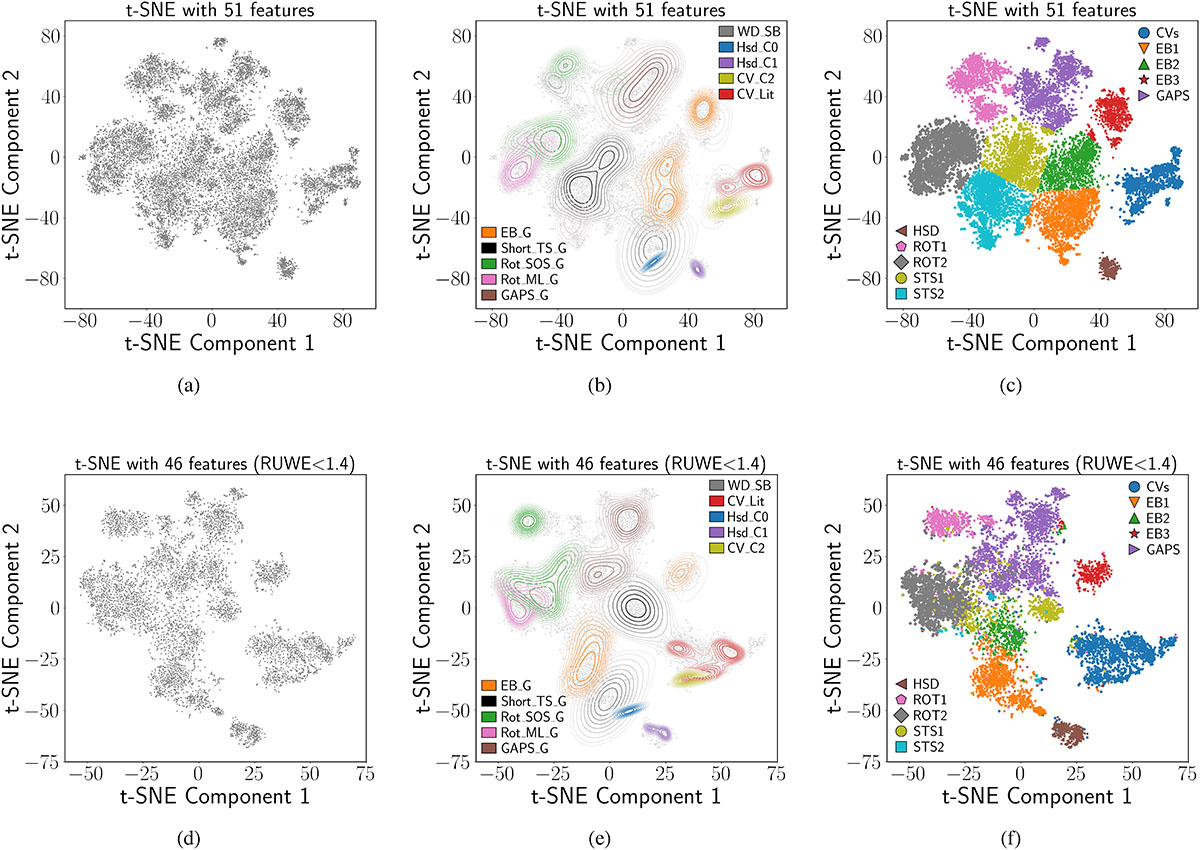
t-SNE embeddings for the original targets (a–c) and the reduced targets with RUWE < 1.4 (d–f). Panels (b) and (e) show the t-SNE visualisations annotated with known classes from various sources: Gaia classifications (legends in the bottom left), SIMBAD (white dwarfs, labelled as WD_SB), Paper I (Hsd_C0, Hsd_C1, CV_C2), and CVs from the literature (CV_Lit). Panel (c) displays cluster labels derived from a Gaussian mixture model, where clusters are labelled according to known object types rather than numerical identifiers. Panel (f) shows the same cluster labels in panel c for the reduced dataset. The SOS and ML annotations in the legends refer to objects classified from the Gaia SOS and ML pipelines, respectively (see also Fig. 3).
Current usage metrics show cumulative count of Article Views (full-text article views including HTML views, PDF and ePub downloads, according to the available data) and Abstracts Views on Vision4Press platform.
Data correspond to usage on the plateform after 2015. The current usage metrics is available 48-96 hours after online publication and is updated daily on week days.
Initial download of the metrics may take a while.