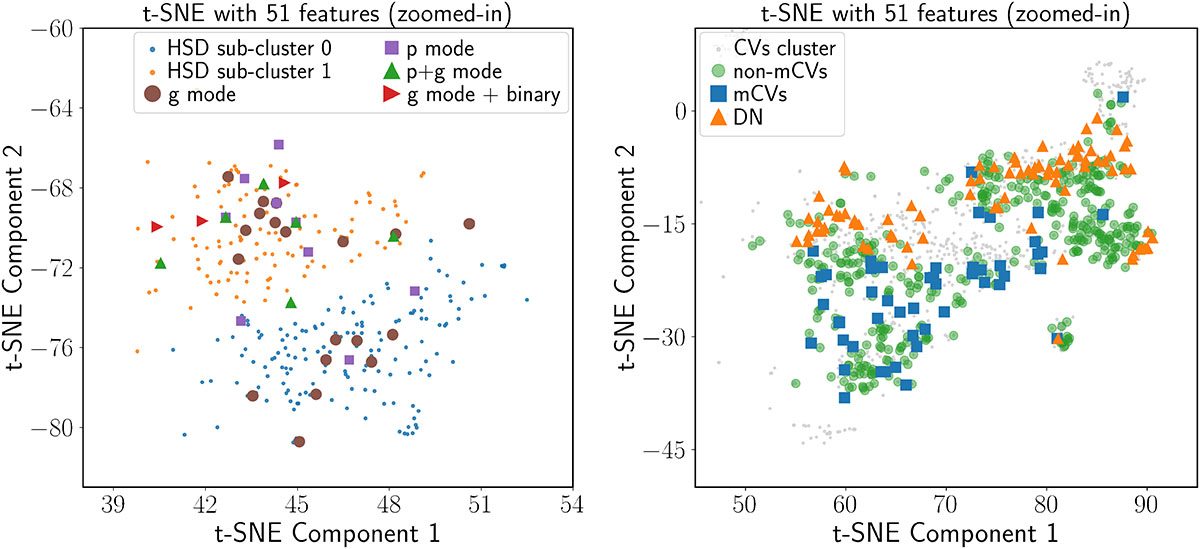
Fig. 6.
Download original image
Close-up view of the t-SNE embeddings for HSD (left panel) and CV (right panel) clusters. Left panel: HSD sub-clusters 0 and 1 represent the cluster HSD in Fig. 2c, where p-mode hot subdwarfs were identified from Baran et al. (2024), while the other modes (g, p+g, g mode + binary) were taken from (Krzesinski & Balona 2022). Right panel: Magnetic CVs (mCVs), non-magnetic CVs (non-mCVs), and dwarf novae (DNs) from Canbay et al. (2023) are shown.
Current usage metrics show cumulative count of Article Views (full-text article views including HTML views, PDF and ePub downloads, according to the available data) and Abstracts Views on Vision4Press platform.
Data correspond to usage on the plateform after 2015. The current usage metrics is available 48-96 hours after online publication and is updated daily on week days.
Initial download of the metrics may take a while.