Fig. 11
Download original image
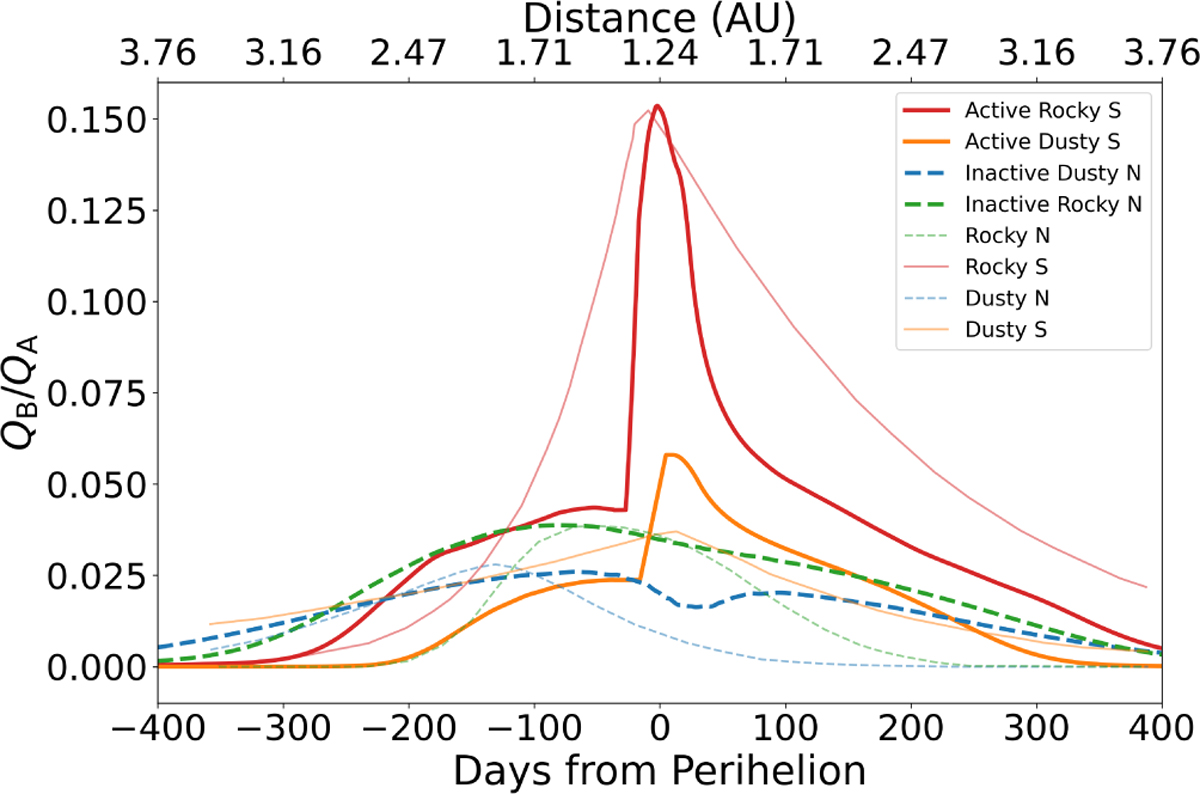
Comparison between the simulated results of the dust layer removal model and the EAF curves from Attree et al. (2024). The light-colored curves are taken from Fig. 5 of Attree et al. (2024), showing the EAF evolution in the four representative regions. Dark curves represent the normalized water production from the dust layer removal model, with colors matching the corresponding representative facets shown in Fig. A.4.
Current usage metrics show cumulative count of Article Views (full-text article views including HTML views, PDF and ePub downloads, according to the available data) and Abstracts Views on Vision4Press platform.
Data correspond to usage on the plateform after 2015. The current usage metrics is available 48-96 hours after online publication and is updated daily on week days.
Initial download of the metrics may take a while.