Fig. 12
Download original image
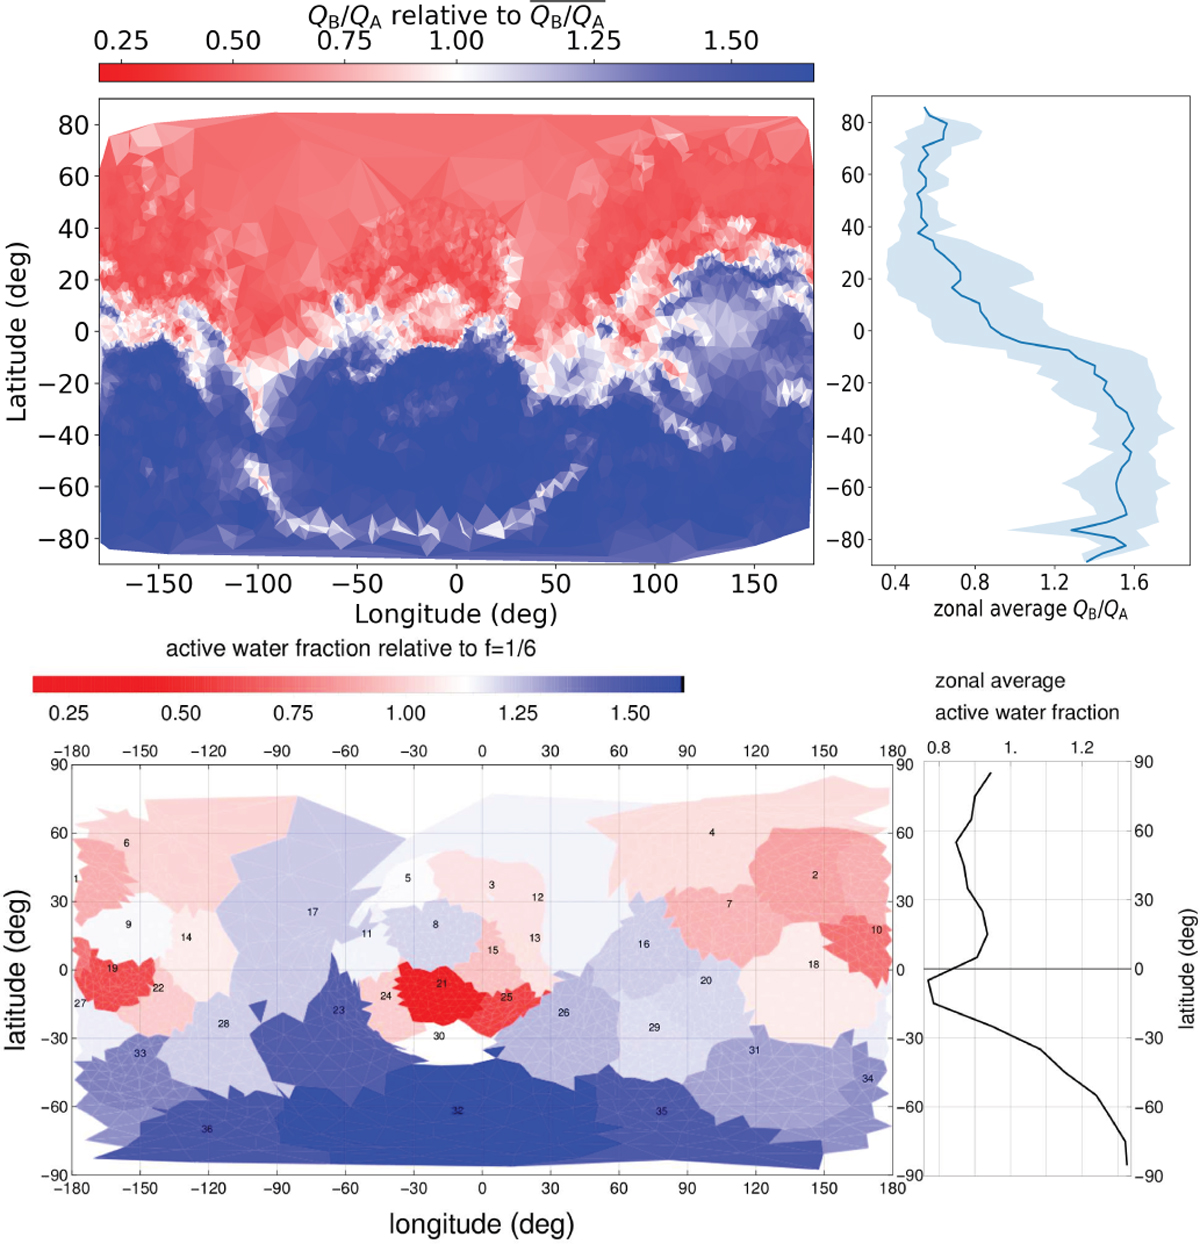
Comparison between the dust layer removal model results and the surface active fraction map in Kramer et al. (2019). Top panel: spatial distribution (left) and latitudinal profile (right) of the water production ratio between the dust layer removal model (QB) and the reference Model A (QB), normalized by its global mean and integrated over ± 300 days around perihelion. The shaded blue area indicates the 1−σ variability within each latitude band. Bottom panel: surface active fraction relative to the average value (left) and its zonal mean profile (right), reproduced from Fig. 10 of Kramer et al. (2019).
Current usage metrics show cumulative count of Article Views (full-text article views including HTML views, PDF and ePub downloads, according to the available data) and Abstracts Views on Vision4Press platform.
Data correspond to usage on the plateform after 2015. The current usage metrics is available 48-96 hours after online publication and is updated daily on week days.
Initial download of the metrics may take a while.