Fig. A.1
Download original image
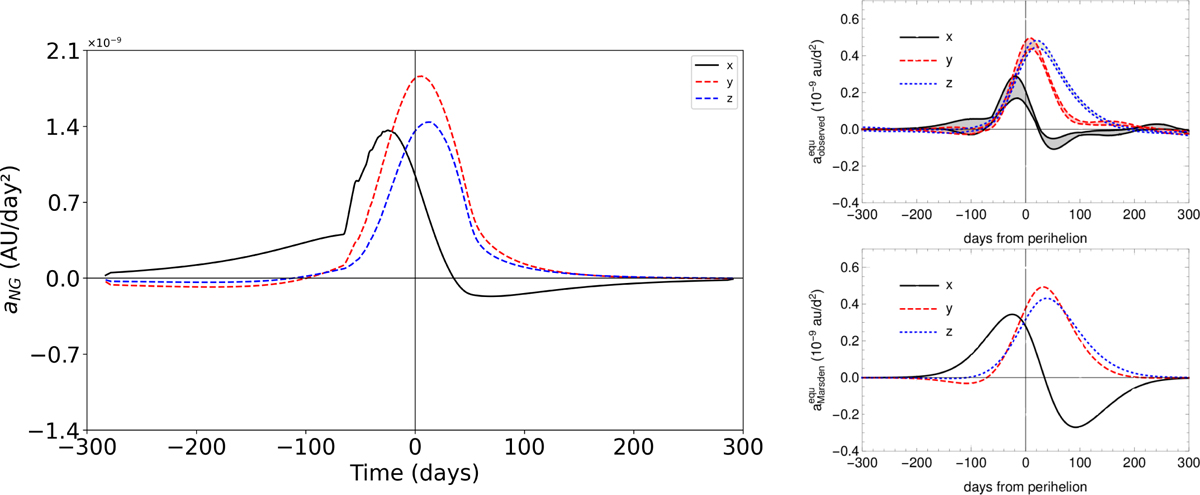
Comparison of modeled and observed NGA curves of 67P/C-G. Left panel: NGA of 67P/C-G in the terrestrial equatorial frame, evaluated under the dust layer removal model composed of 0.6 mm particles and a porosity of 0.6. Right panel: Fig. 2 from Kramer & Läuter (2019), showing the observed NGA (top) and the Marsden model simulation (bottom). Both panels are plotted on the same vertical scale for direct comparison.
Current usage metrics show cumulative count of Article Views (full-text article views including HTML views, PDF and ePub downloads, according to the available data) and Abstracts Views on Vision4Press platform.
Data correspond to usage on the plateform after 2015. The current usage metrics is available 48-96 hours after online publication and is updated daily on week days.
Initial download of the metrics may take a while.