Fig. A.2
Download original image
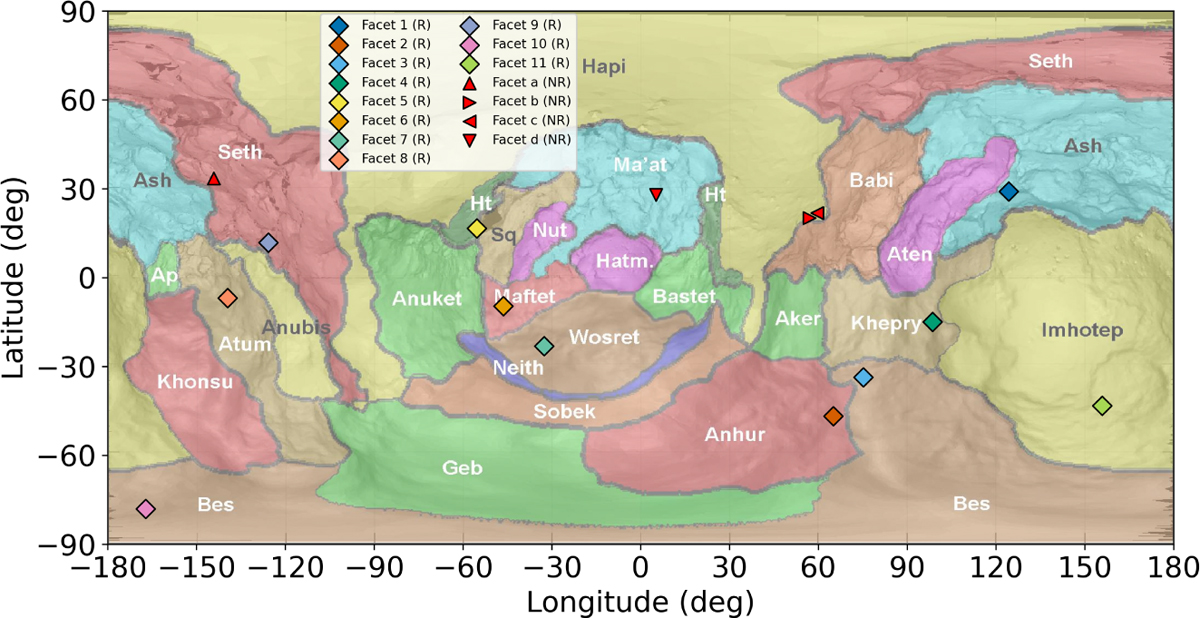
Locations of selected facets, identified through clustering analysis of illumination curves, are marked on the 67P/C-G comet 2D map from El-Maarry et al. (2016). In this representation, facets labeled “R” indicate regions where removal activity occurs in the global simulation of the dust layer removal model for 67P/C-G, whereas those labeled “NR” correspond to regions where no removal activity is observed in the simulation.
Current usage metrics show cumulative count of Article Views (full-text article views including HTML views, PDF and ePub downloads, according to the available data) and Abstracts Views on Vision4Press platform.
Data correspond to usage on the plateform after 2015. The current usage metrics is available 48-96 hours after online publication and is updated daily on week days.
Initial download of the metrics may take a while.