Fig. 2
Download original image
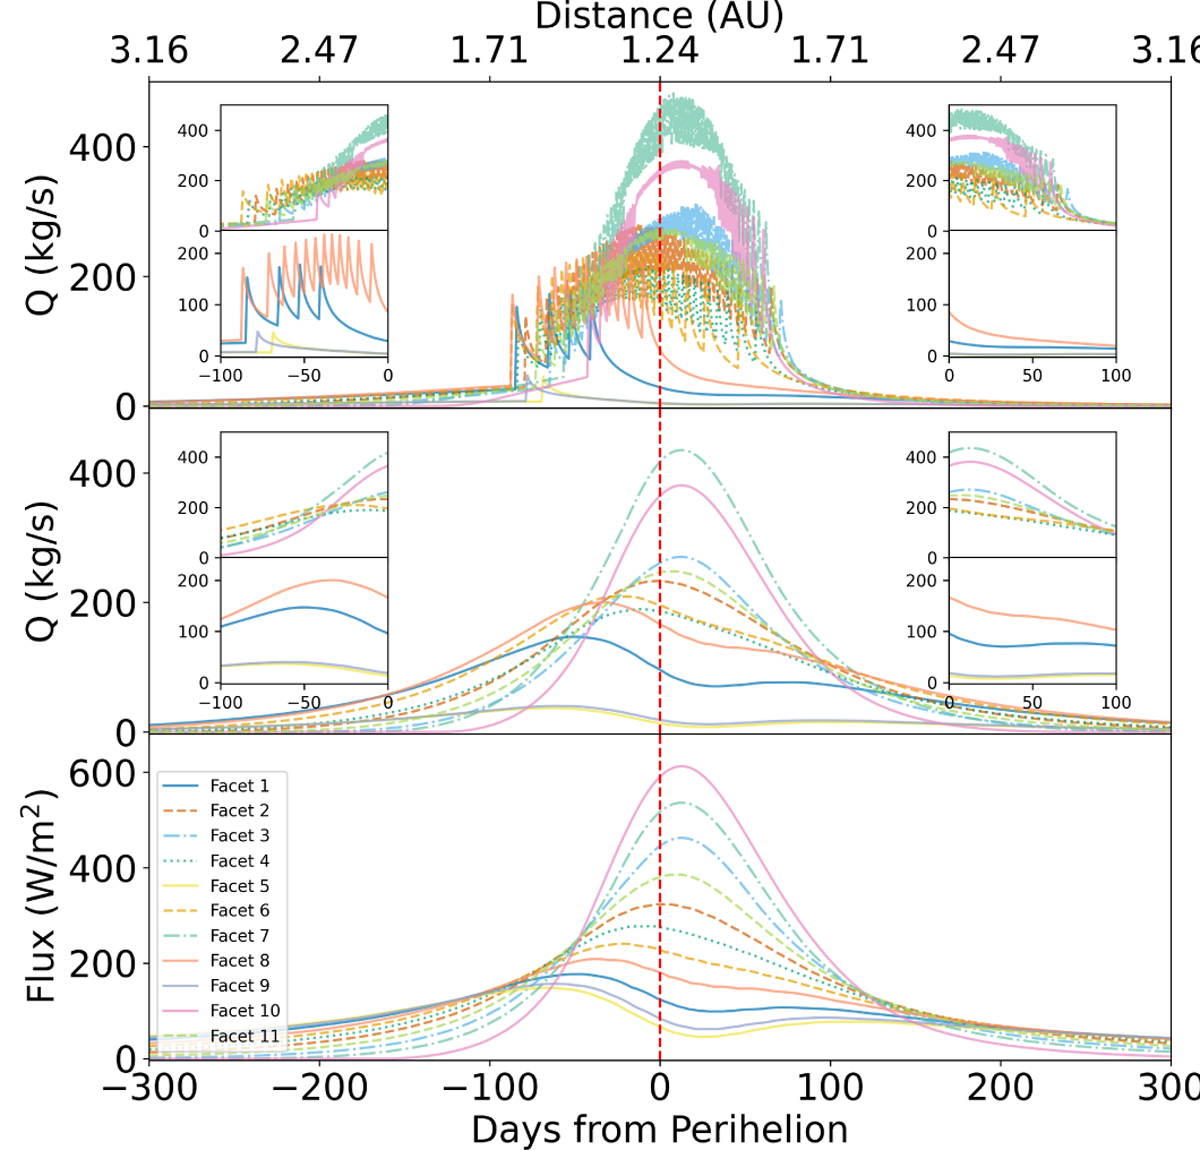
From top to bottom, the panels show (1) the weighted water production rates of the 11 representative facets under the dust layer removal model; (2) the corresponding rates under the constant dust layer model; and (3) the solar illumination curves of each facet. The vertical dashed lines indicate the time of perihelion passage. The insets in each panel provide a magnified view of the near-perihelion region (± 100 days), highlighting differences in peak timing, amplitude, and asymmetry between the two models, as well as their response to the rapidly changing solar flux.
Current usage metrics show cumulative count of Article Views (full-text article views including HTML views, PDF and ePub downloads, according to the available data) and Abstracts Views on Vision4Press platform.
Data correspond to usage on the plateform after 2015. The current usage metrics is available 48-96 hours after online publication and is updated daily on week days.
Initial download of the metrics may take a while.