Fig. 3
Download original image
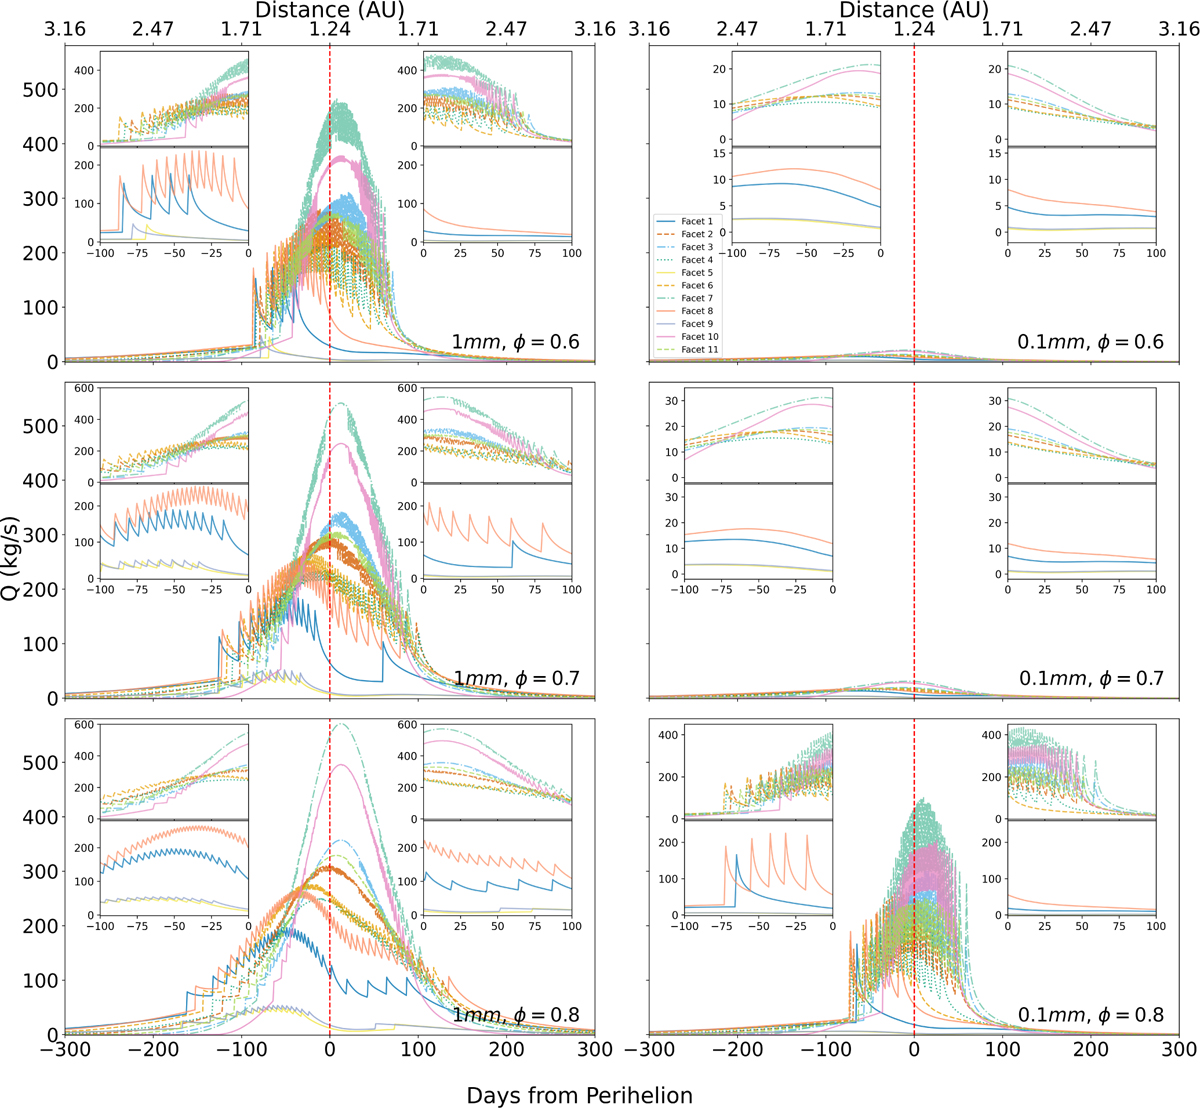
Variation of the water production rate near perihelion under the dust layer removal model for different combinations of dust particle size and porosity. Each panel shows simulation results for a specific particle size (1 mm or 0.1 mm) and three porosity values (0.6, 0.7, and 0.8), as indicated in the bottom-right corner of each subplot. The vertical dashed line marks the time of perihelion passage (x=0). The insets highlight the detailed structure of cyclic dust removal activity near perihelion. In each panel, the upper and lower insets correspond to cases from Fig. 2 that exhibit sustained activity across perihelion and those in which dust removal ceases before perihelion, respectively.
Current usage metrics show cumulative count of Article Views (full-text article views including HTML views, PDF and ePub downloads, according to the available data) and Abstracts Views on Vision4Press platform.
Data correspond to usage on the plateform after 2015. The current usage metrics is available 48-96 hours after online publication and is updated daily on week days.
Initial download of the metrics may take a while.