Fig. 5
Download original image
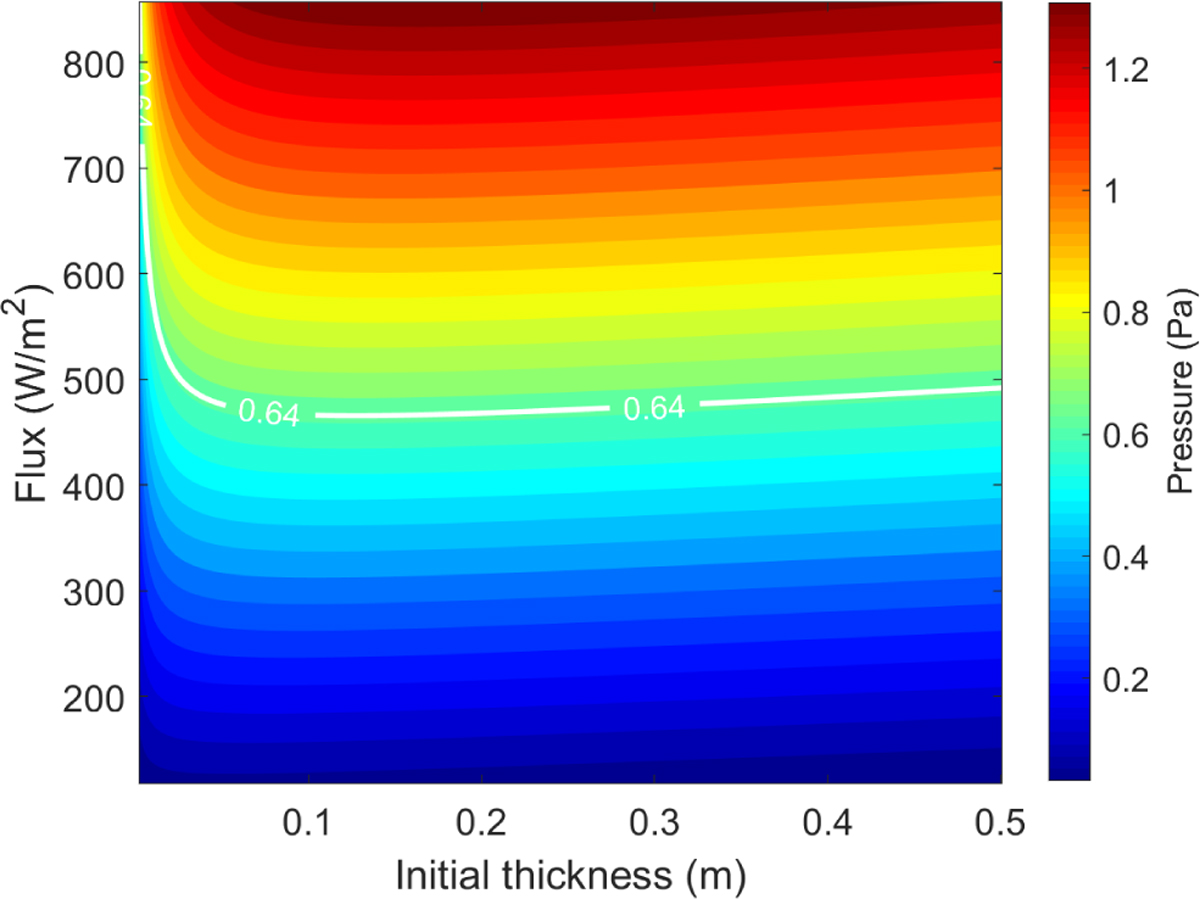
Color map of the variation in subsurface pressure (Pa) as a function of dust layer thickness (m) and input solar flux (W/m2). The color scale indicates the vapor pressure at the boundary beneath the porous layer. The white curve marks the critical pressure of 0.64 Pa, which corresponds to the tensile strength of the dust layer properties. Regions above this threshold suggest conditions under which dust ejection may be triggered.
Current usage metrics show cumulative count of Article Views (full-text article views including HTML views, PDF and ePub downloads, according to the available data) and Abstracts Views on Vision4Press platform.
Data correspond to usage on the plateform after 2015. The current usage metrics is available 48-96 hours after online publication and is updated daily on week days.
Initial download of the metrics may take a while.