Fig. 9
Download original image
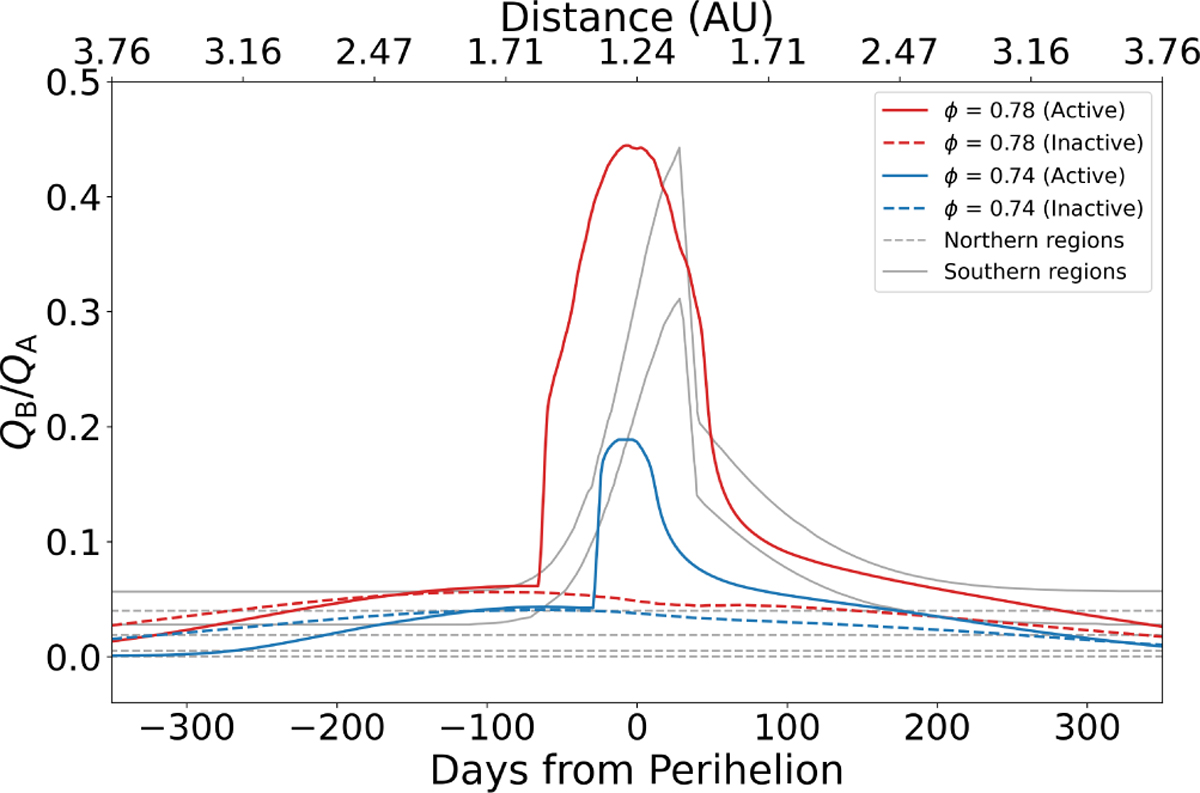
Comparison between the simulated results of the dust layer removal model and the EAF curves from Attree et al. (2023). The solid and dashed gray lines are directly taken from Fig. 2 of Attree et al. (2023), representing the EAF evolution in southern and other regions, respectively. Solid red and blue lines indicate the total water production from active facets in the dust removal model (porosity ϕ=0.78 and 0.74, respectively), normalized by Model A. Dashed lines show the corresponding ratios for inactive facets. In all cases, the dust particle radius was set to 0.1 mm, and the initial dust layer thickness was set to 4 cm.
Current usage metrics show cumulative count of Article Views (full-text article views including HTML views, PDF and ePub downloads, according to the available data) and Abstracts Views on Vision4Press platform.
Data correspond to usage on the plateform after 2015. The current usage metrics is available 48-96 hours after online publication and is updated daily on week days.
Initial download of the metrics may take a while.