Fig. 1.
Download original image
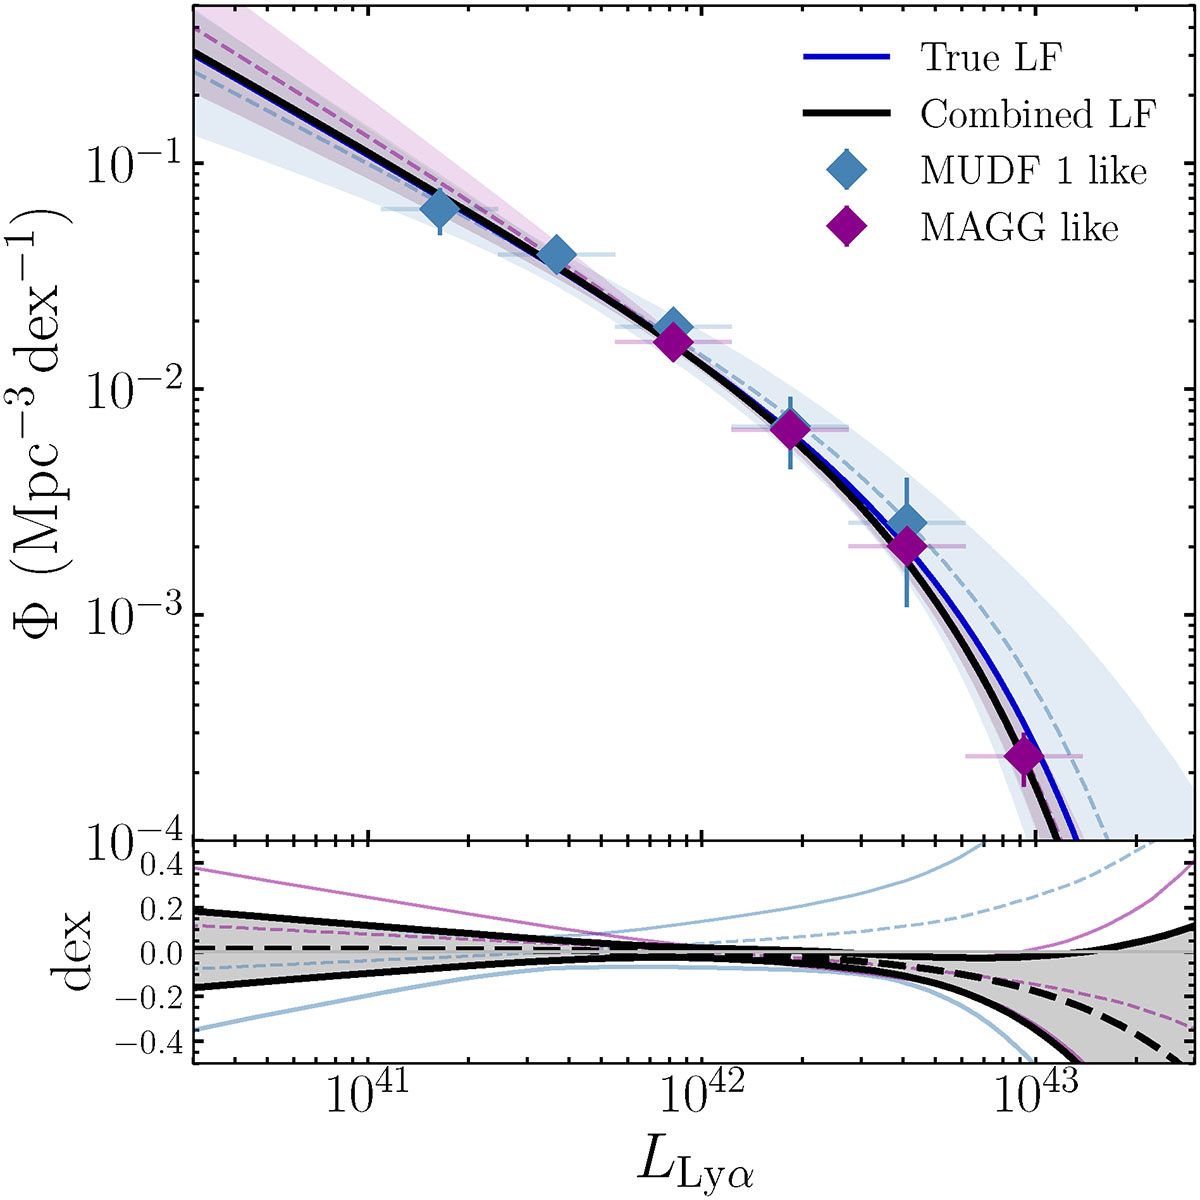
Results of the Bayesian model applied to mock catalogues for both individual surveys and their combination. This test demonstrates how combining multiple surveys with varying depths helps constrain the LF with reduced statistical uncertainty across a wider dynamical range of luminosities. In the top panel the solid dark blue line indicates the true LF used to generate the mock catalogues. The light blue (magenta) diamonds represent the 1/Vmax estimator of the LF obtained from the MUDF 1- (MAGG)-like survey, along with the median of the posterior samples from the Bayesian model (dashed line) and the corresponding 90% credible interval. The solid black line shows the median when combining the two surveys, with the associated 90% credible interval. Horizontal bars on the diamonds represent the bin widths, while vertical bars are the Poisson errors associated with the 1/Vmax estimator. In the bottom panel the dashed lines (same colours as in the top panel) show the logarithmic difference between the median LF obtained from the Bayesian model and the true LF. The solid lines indicate the 5th and 95th percentiles relative to the true LF.
Current usage metrics show cumulative count of Article Views (full-text article views including HTML views, PDF and ePub downloads, according to the available data) and Abstracts Views on Vision4Press platform.
Data correspond to usage on the plateform after 2015. The current usage metrics is available 48-96 hours after online publication and is updated daily on week days.
Initial download of the metrics may take a while.