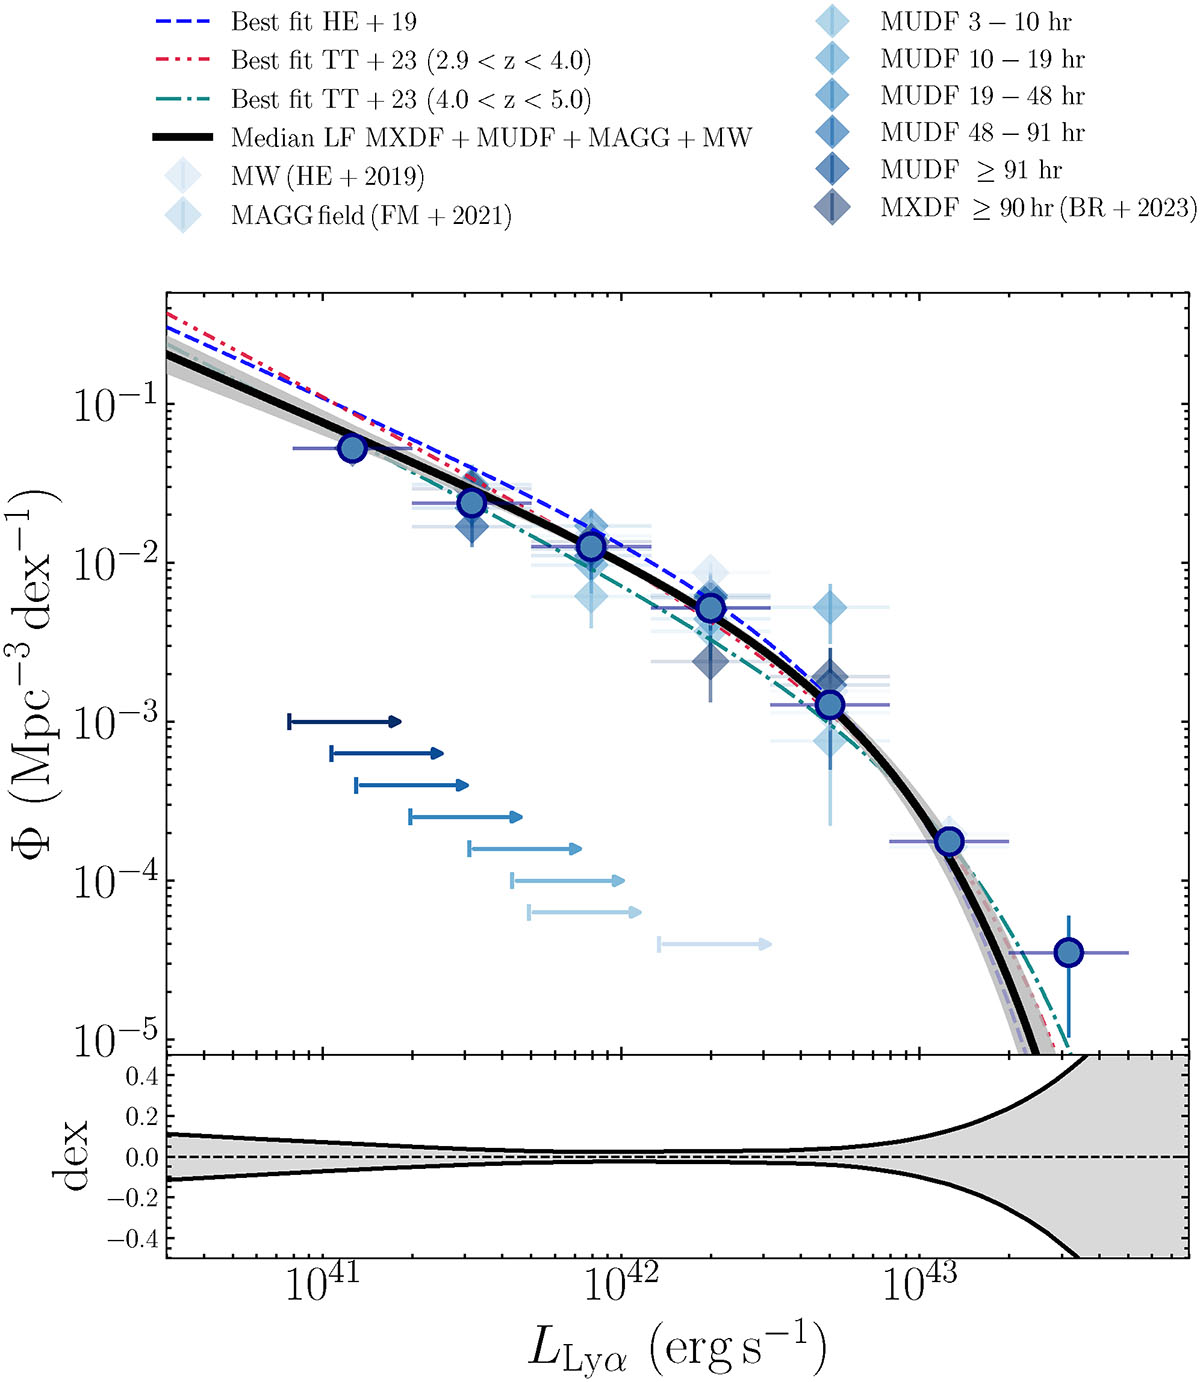
Fig. 2.
Download original image
LF obtained from the combination of the four MUSE surveys considered in this study (see Table 1). Top panel: Median LF reconstructed using our Bayesian model applied to the full sample (solid black line), along with the corresponding 90% credible interval. The blue colour-coded diamonds represent the 1/Vmax estimates from each individual survey, with vertical bars indicating the Poisson uncertainties and horizontal bars the bin widths. The dark blue circles show the weighted average of the 1/Vmax points across surveys in each bin. Arrows in the same colour scheme indicate the luminosity limit above which each survey reaches a completeness higher than 10%. For comparison, coloured lines with different line styles display the best-fit Schechter LFs from various studies in the literature (Herenz et al. 2019; Thai et al. 2023). Bottom panel: Statistical uncertainty on the LF as a function of luminosity. The solid black lines show the relative 5th and 95th percentiles of the Bayesian posterior distribution.
Current usage metrics show cumulative count of Article Views (full-text article views including HTML views, PDF and ePub downloads, according to the available data) and Abstracts Views on Vision4Press platform.
Data correspond to usage on the plateform after 2015. The current usage metrics is available 48-96 hours after online publication and is updated daily on week days.
Initial download of the metrics may take a while.