Fig. A.1.
Download original image
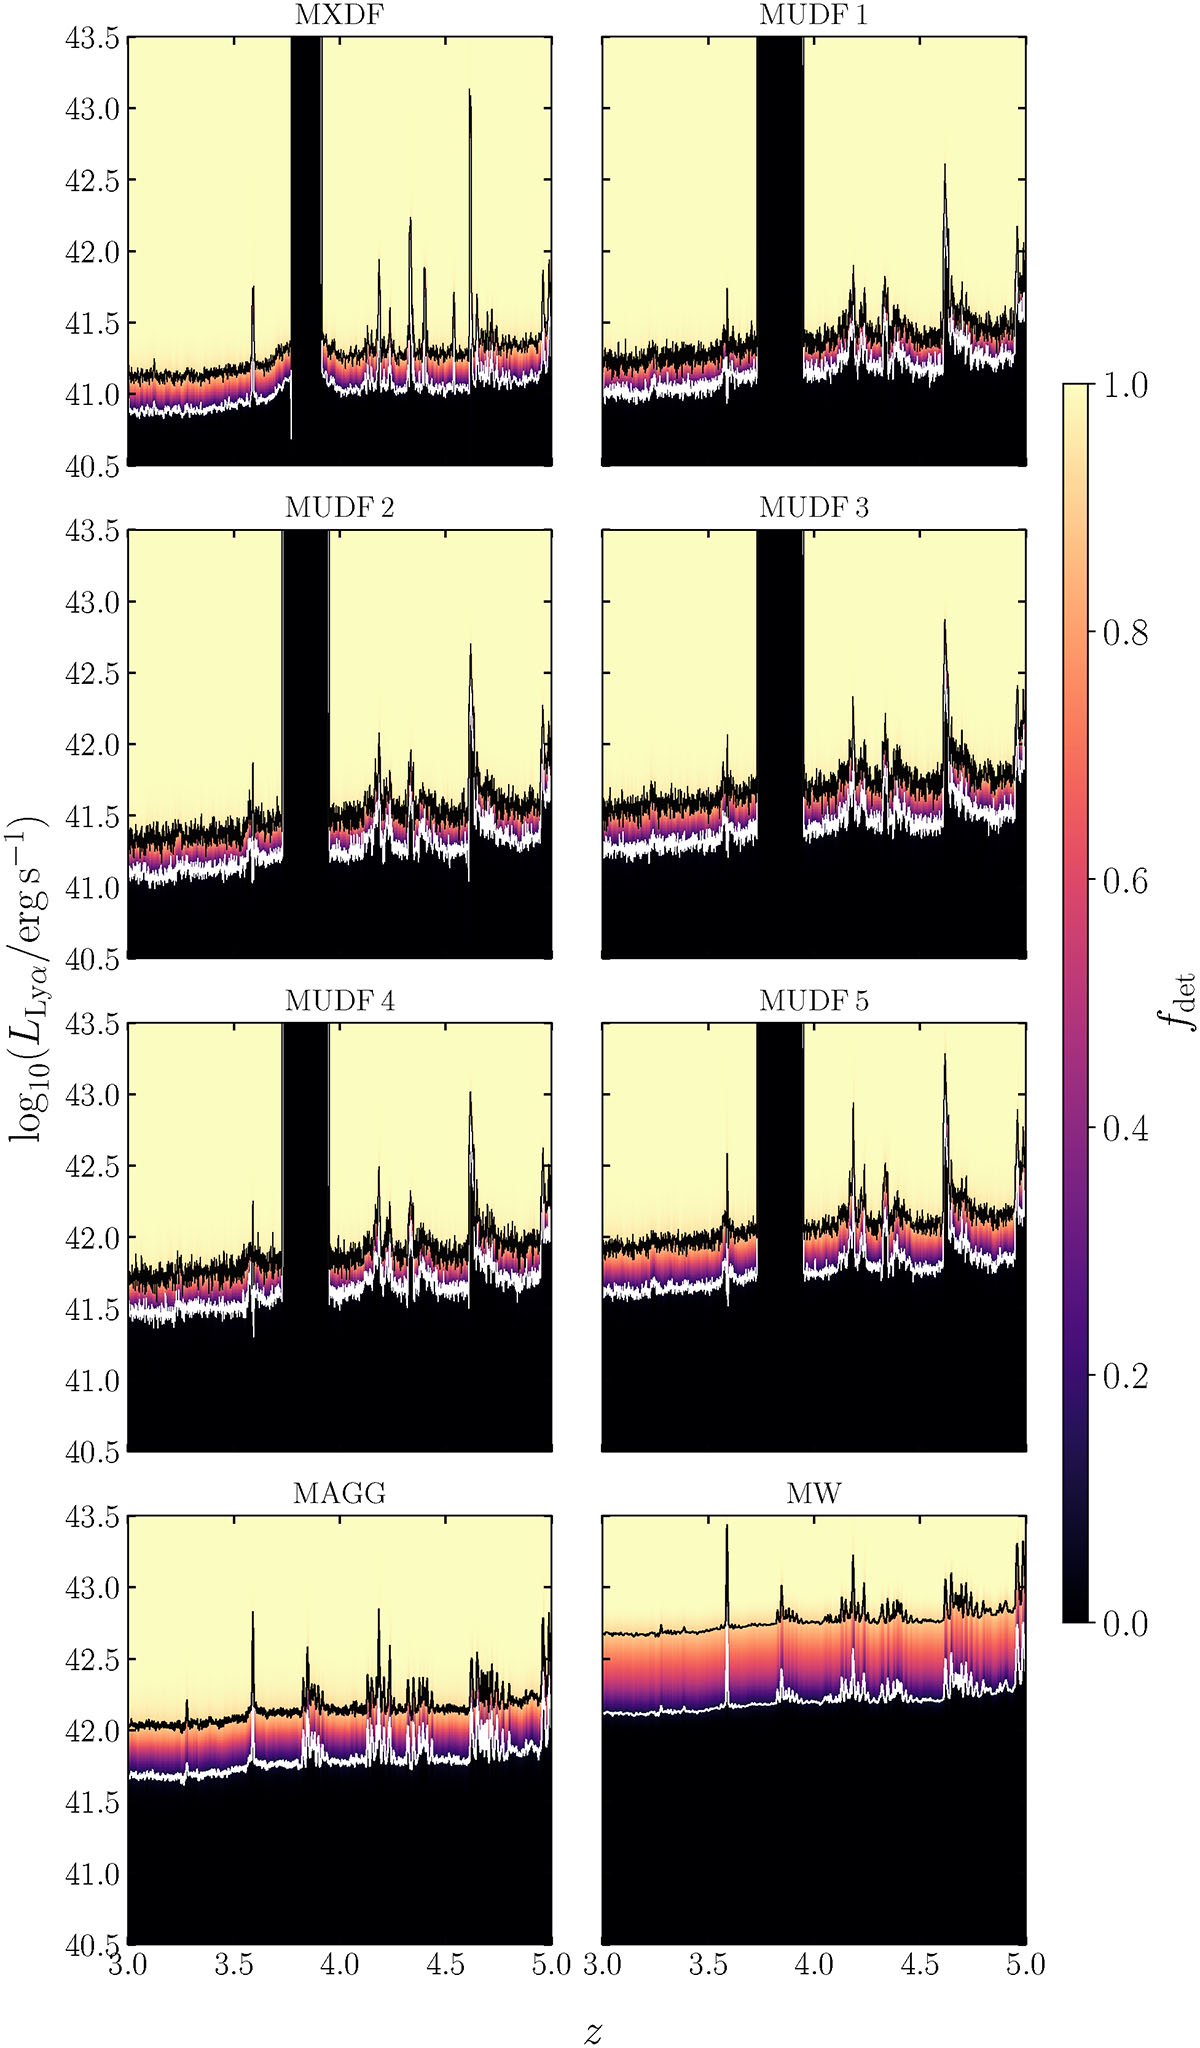
Selection functions ![]() for LAEs analysed in each individual survey. The white and black contours indicate the 10% and 90% completeness limits, respectively. The MW and MAGG selection functions are taken from Herenz et al. (2019) and Fossati et al. (2021), respectively. The vertical stripe with a detection fraction of zero around redshift z ∼ 3.8 in the MXDF and MUDF surveys is caused by the Ground Layer Adaptive Optics module, which uses an artificial laser guide star to improve image quality during the observations (Fossati et al. 2019; Bacon et al. 2023). This region therefore contains no data.
for LAEs analysed in each individual survey. The white and black contours indicate the 10% and 90% completeness limits, respectively. The MW and MAGG selection functions are taken from Herenz et al. (2019) and Fossati et al. (2021), respectively. The vertical stripe with a detection fraction of zero around redshift z ∼ 3.8 in the MXDF and MUDF surveys is caused by the Ground Layer Adaptive Optics module, which uses an artificial laser guide star to improve image quality during the observations (Fossati et al. 2019; Bacon et al. 2023). This region therefore contains no data.
Current usage metrics show cumulative count of Article Views (full-text article views including HTML views, PDF and ePub downloads, according to the available data) and Abstracts Views on Vision4Press platform.
Data correspond to usage on the plateform after 2015. The current usage metrics is available 48-96 hours after online publication and is updated daily on week days.
Initial download of the metrics may take a while.