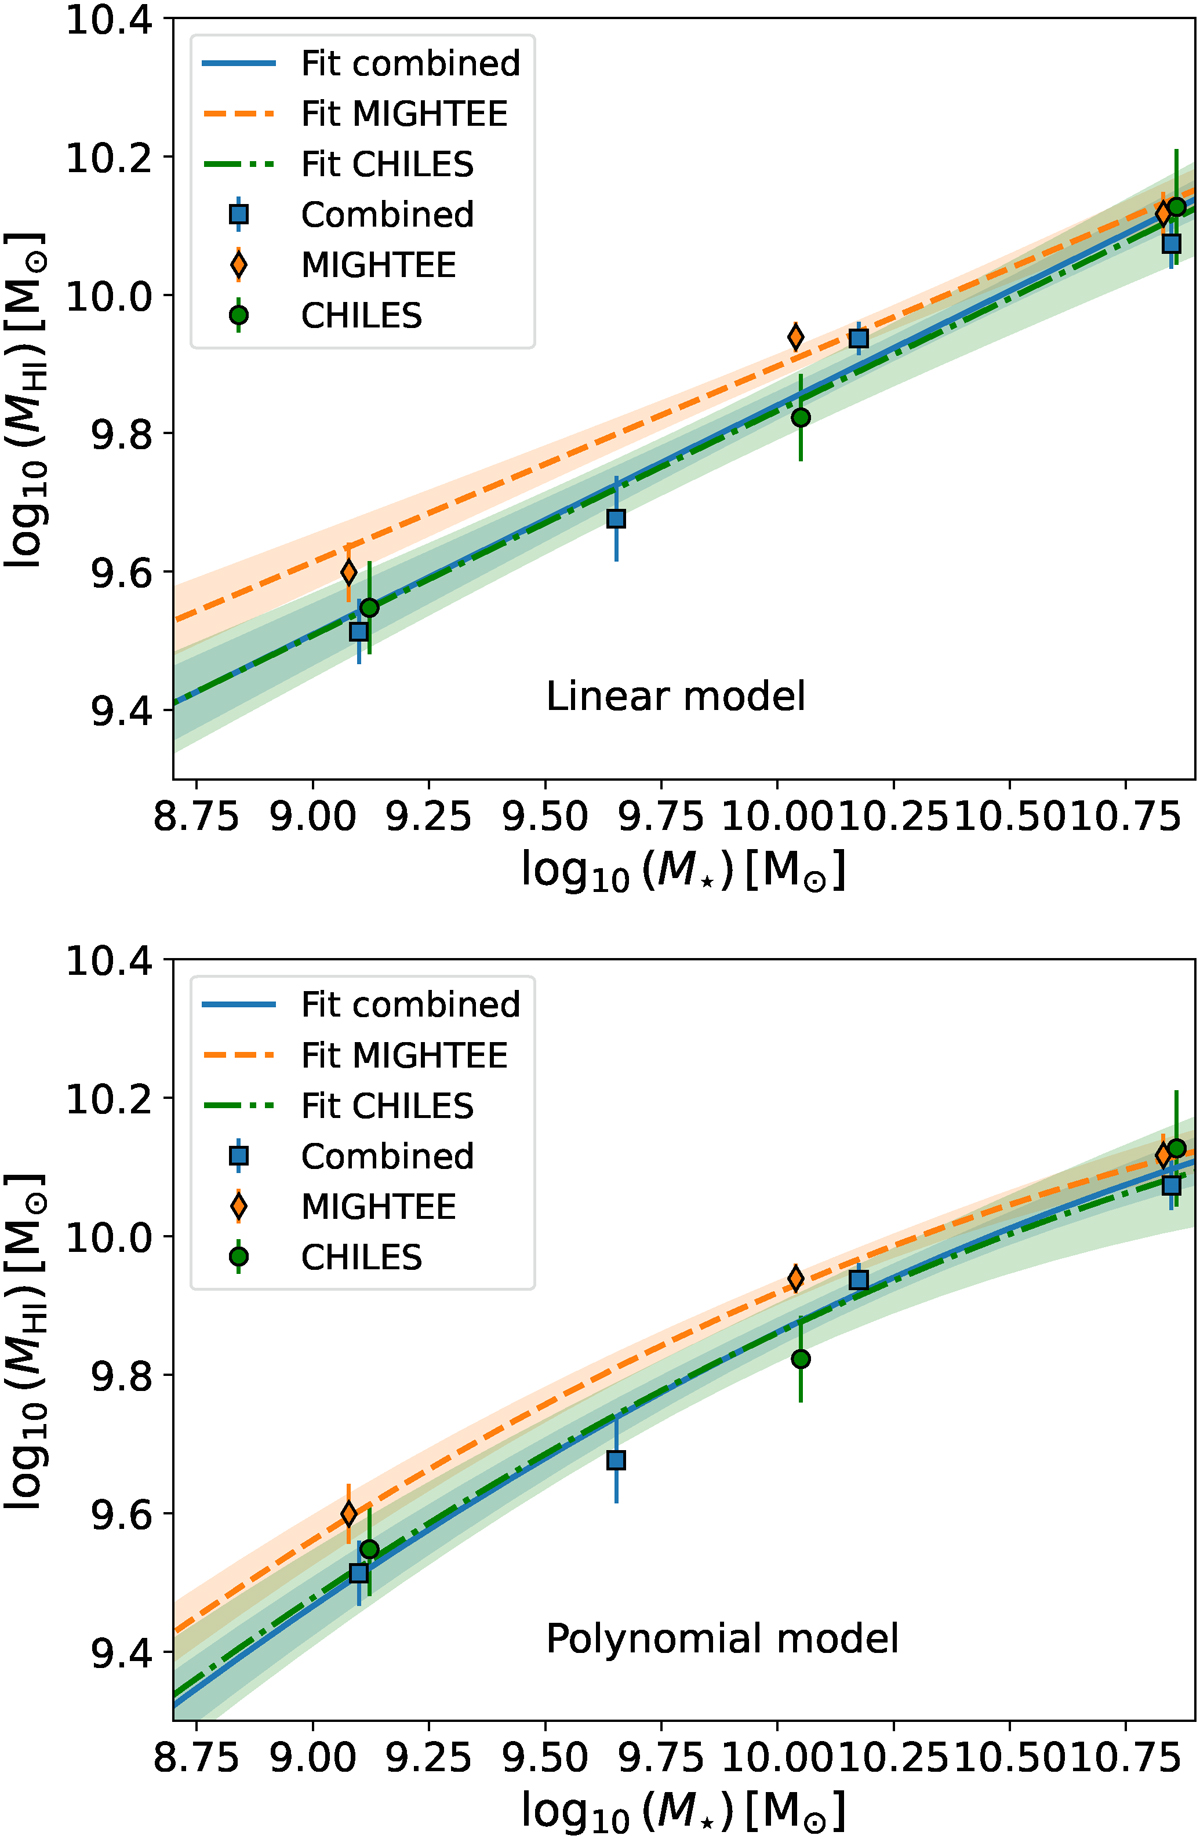
Fig. 1.
Download original image
MHI − M⋆ best-fitting scaling relations to the stacking results from Bianchetti et al. (2025). Top: Linear fit to the data. Bottom: Polynomial fit. The data points are shown as blue squares (combined stacking), green diamonds (MIGHTEE stacking), and green circles (CHILES stacking), and the best-fit models as solid blue (combined stacking), dashed orange (MIGHTEE stacking), and dotted-dashed green lines (CHILES stacking).
Current usage metrics show cumulative count of Article Views (full-text article views including HTML views, PDF and ePub downloads, according to the available data) and Abstracts Views on Vision4Press platform.
Data correspond to usage on the plateform after 2015. The current usage metrics is available 48-96 hours after online publication and is updated daily on week days.
Initial download of the metrics may take a while.