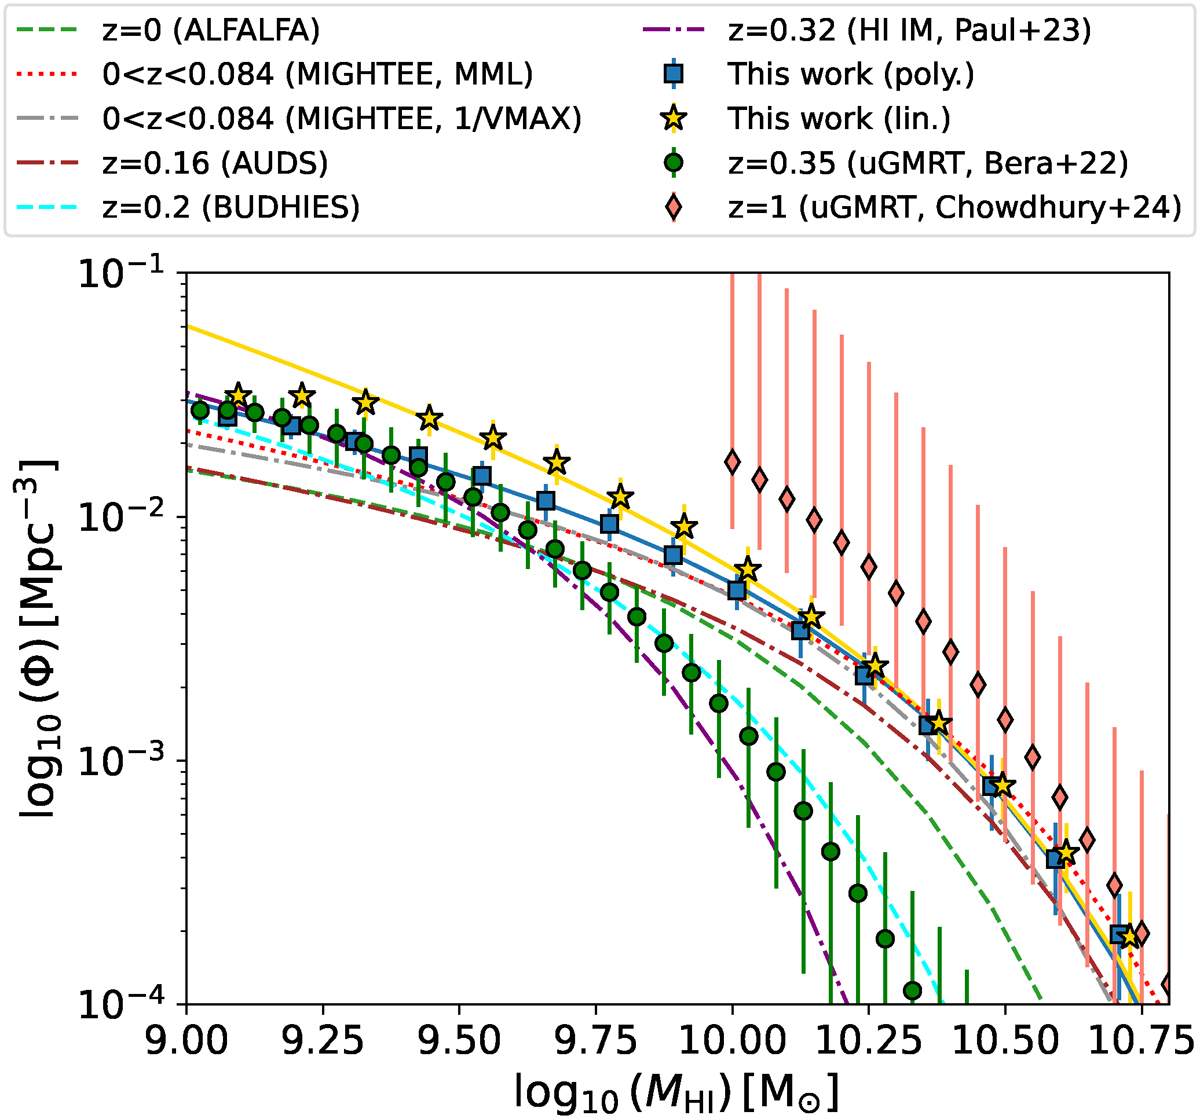
Fig. 2.
Download original image
Compilation of HIMF results from this work and from the literature. We show the resulting HIMF from the linear (yellow stars) and polynomial models (blue squares) as well as their best-fitting models as solid lines of the same color. We display the HIMFs from: ALFALFA at z ∼ 0 (Jones et al. 2018) as a dashed green line, MIGHTEE at 0 < z < 0.084 as dotted red (1/Vmax) and dotted-dashed gray (MML) lines (Ponomareva et al. 2023), AUDS at z ∼ 0.16 as a dotted-dashed brown line (Hoppmann et al. 2015), BUDHIES at z ∼ 0.2 as a dashed cyan line (Gogate 2022), the intensity mapping experiment at z ∼ 0.32 as a dotted-dashed purple line (Paul et al. 2023), and as green circles and orange diamonds the results from a similar approach as that followed here applied to stacking results from uGMRT data at z ∼ 0.35 (Bera et al. 2022) and z ∼ 1 (Chowdhury et al. 2024).
Current usage metrics show cumulative count of Article Views (full-text article views including HTML views, PDF and ePub downloads, according to the available data) and Abstracts Views on Vision4Press platform.
Data correspond to usage on the plateform after 2015. The current usage metrics is available 48-96 hours after online publication and is updated daily on week days.
Initial download of the metrics may take a while.