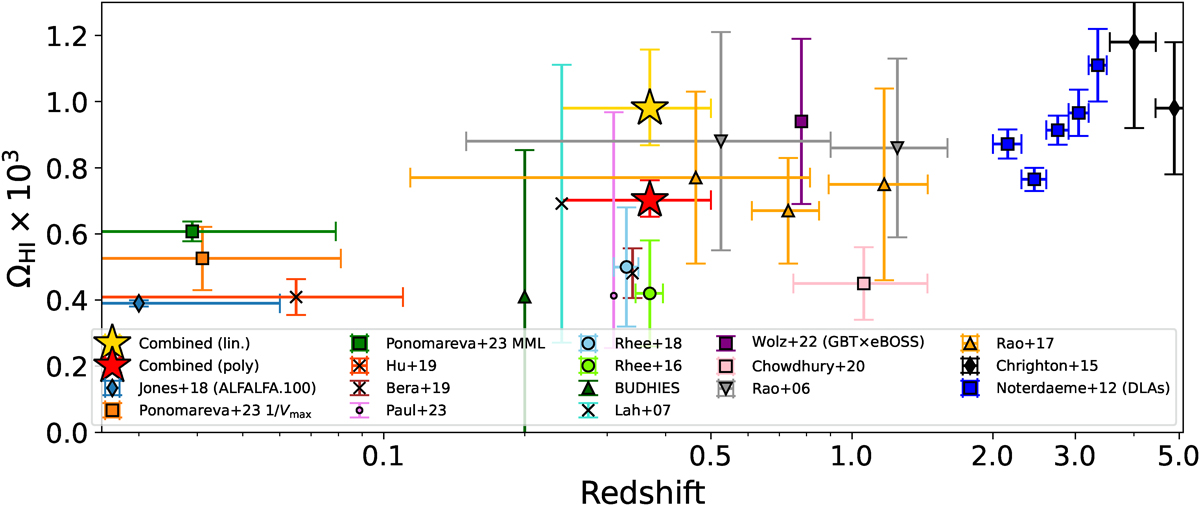
Fig. 3.
Download original image
Compilation of ΩHI results as a function of redshift from this work and from the literature: from this work, from the combined stacking with a linear model (yellow star) and with a polynomial model (red star); from ALFALFA at z ∼ 0 (blue diamond: Jones et al. 2018); from MIGHTEE at 0 < z < 0.084 with the 1/Vmax method (orange) and the MML method (green; Ponomareva et al. 2023); from a H I stacking based on WSRT data at z ∼ 0.066 (a red cross; Hu et al. 2019); from H I stacking on uGMRT data at z ∼ 0.35 (brown cross; Bera et al. 2019); from a H I intensity mapping experiment with MeerKAT (pink circle; Paul et al. 2023); from two H I stacking experiments based on uGMRT data at ∼0.32 (blue circle; Rhee et al. 2016) and z ∼ 0.37 (green circle; Rhee et al. 2016); from BUDHIES at ∼0.2 (green upward triangle; Gogate 2022); from H I stacking at z ∼ 0.24 based on GMRT data (cyan cross; Lah et al. 2007); from the cross-correlation between H I intensity mapping from the GBT and optical galaxies from the eBOSS survey (purple square; Wolz et al. 2022); from damped Lyα systems (DLAs) at z < 1.65 from (Rao et al. 2006, downward gray triangles) and (Rao et al. 2017, orange upward triangles); and from DLAs at z > 2 (dark blue squares; Noterdaeme et al. 2012) and at z > 4.4 (black diamonds; Crighton et al. 2015).
Current usage metrics show cumulative count of Article Views (full-text article views including HTML views, PDF and ePub downloads, according to the available data) and Abstracts Views on Vision4Press platform.
Data correspond to usage on the plateform after 2015. The current usage metrics is available 48-96 hours after online publication and is updated daily on week days.
Initial download of the metrics may take a while.