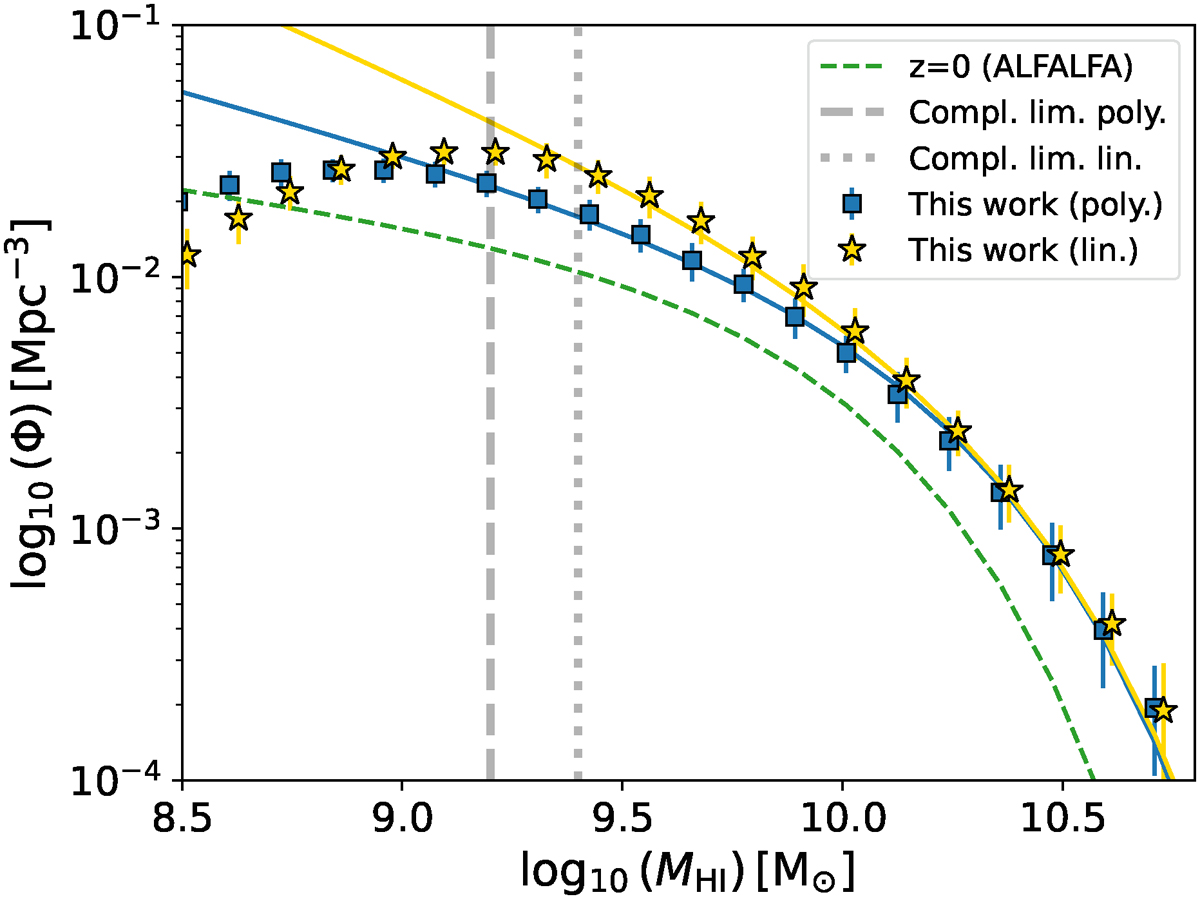
Fig. D.1.
Download original image
Completeness effects on the HIMFs obtained by assuming the linear (yellow stars) and the polynomial (blue squares) models for the MHI − M⋆ relation. The vertical dashed and dotted gray lines stand for the conservative completeness limits log10(MHI/M⊙) = 9.2 and log10(MHI/M⊙) = 9.4 for the polynomial and linear cases, respectively, and represent the lower limits used for the fit of the Schechter models to the data. We show the best-fitting Schechter models obtained by adopting the fitting strategy outlined above as solid yellow (linear model) and solid blue (polynomial model). We also display the HIMF from ALFALFA at z ∼ 0 (dashed green) for comparison.
Current usage metrics show cumulative count of Article Views (full-text article views including HTML views, PDF and ePub downloads, according to the available data) and Abstracts Views on Vision4Press platform.
Data correspond to usage on the plateform after 2015. The current usage metrics is available 48-96 hours after online publication and is updated daily on week days.
Initial download of the metrics may take a while.