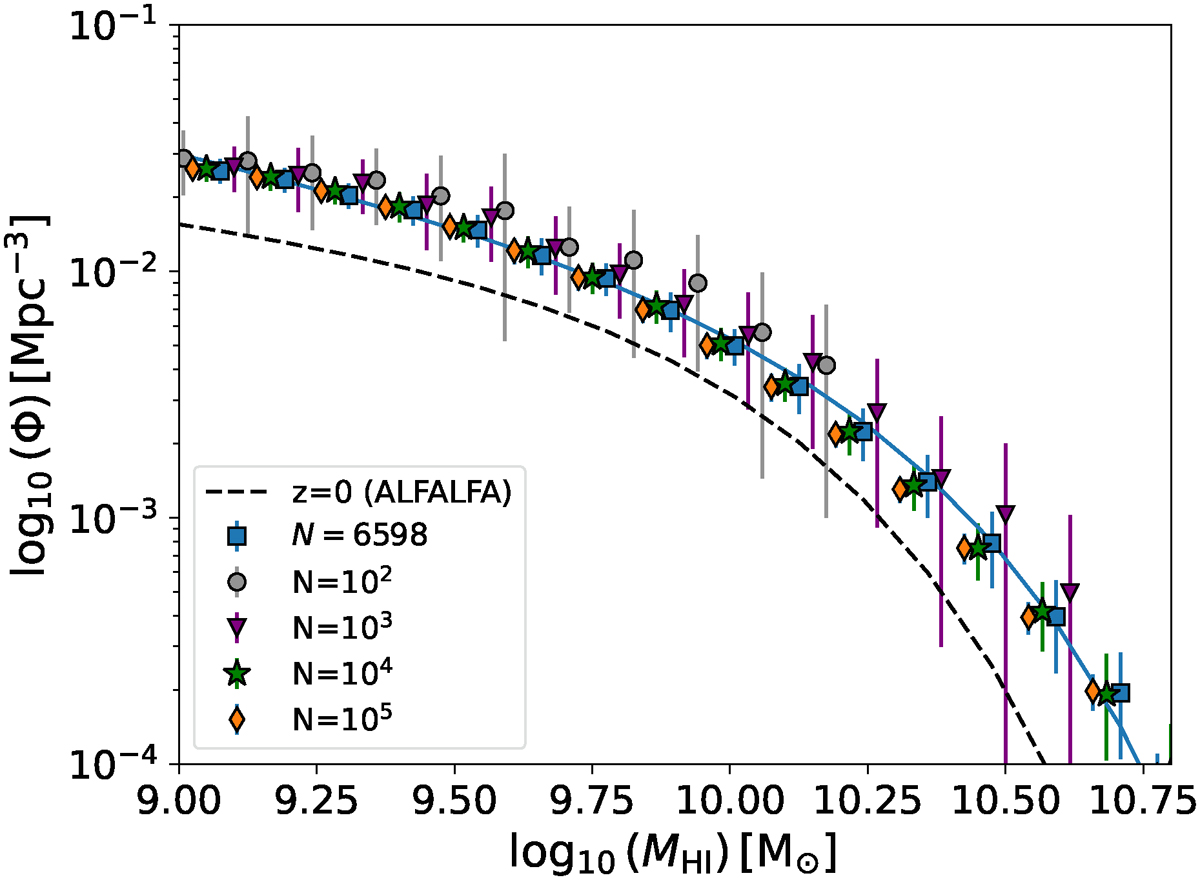
Fig. E.1.
Download original image
Results for the HIMF from the combined stacking case as a function of the chosen sample size (N) and assuming the polynomial model for the MHI − M⋆ relation. We show the main results from this paper: N = 6598 (blue squares), N = 102 (gray circles), N = 103 (purple downward triangles), N = 104 (green stars), and N = 105 (orange diamonds). We also display the HIMF from ALFALFA at z ∼ 0 as a dashed black line for comparison. A tiny horizontal shift was applied to the data points to avoid overlaps and to ease visualization.
Current usage metrics show cumulative count of Article Views (full-text article views including HTML views, PDF and ePub downloads, according to the available data) and Abstracts Views on Vision4Press platform.
Data correspond to usage on the plateform after 2015. The current usage metrics is available 48-96 hours after online publication and is updated daily on week days.
Initial download of the metrics may take a while.