Fig. 2
Download original image
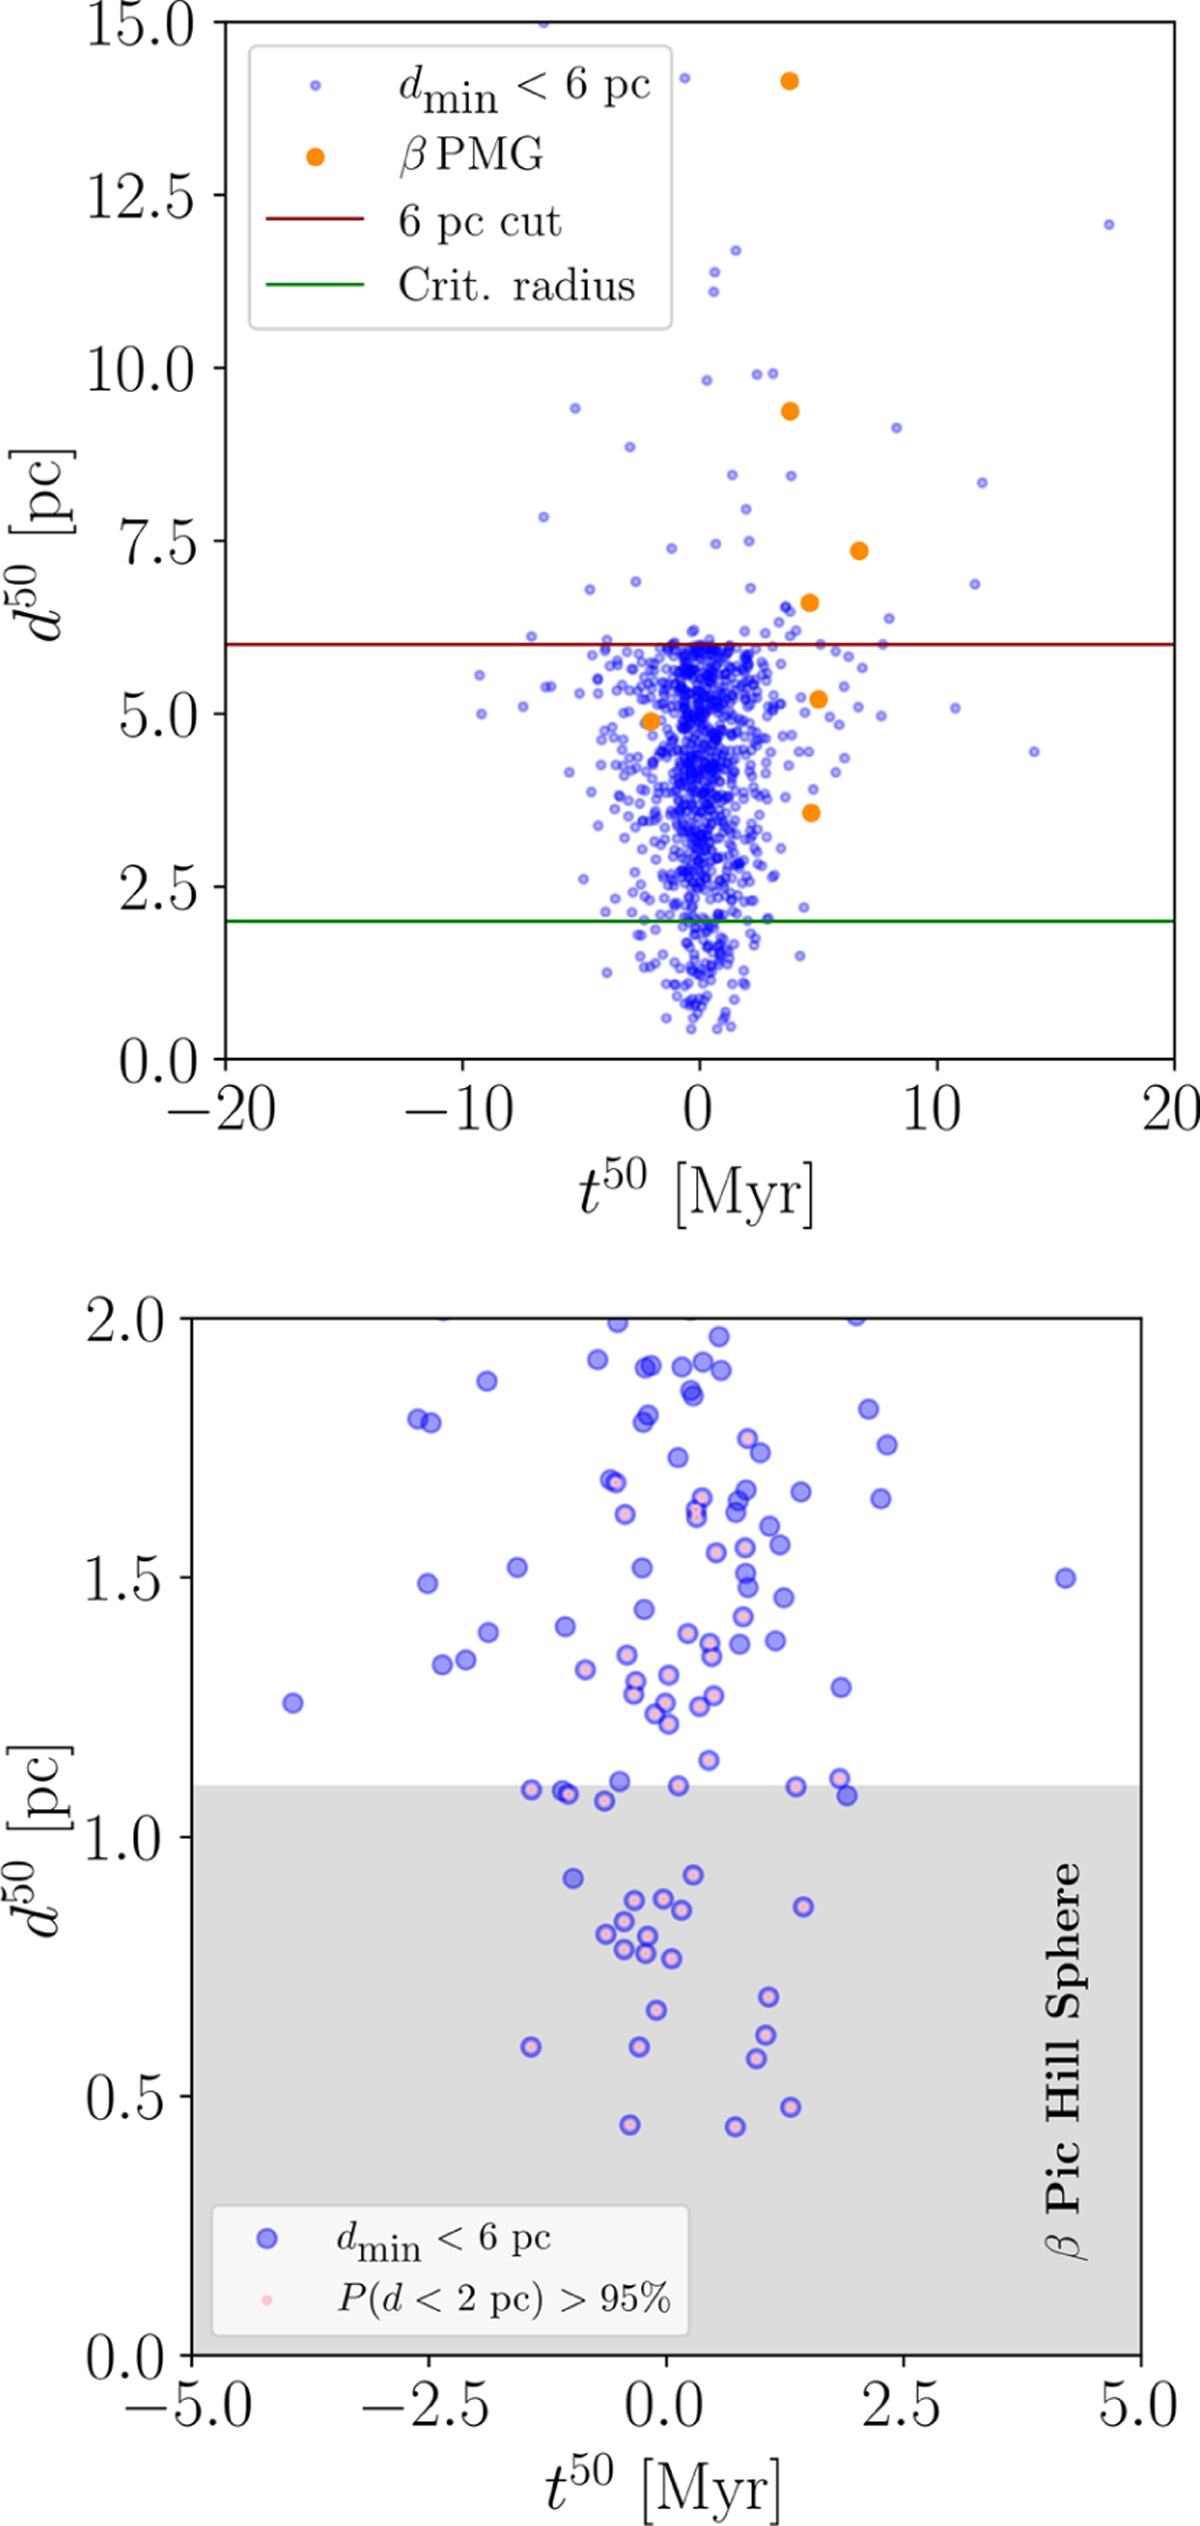
Top: medians of the distance versus time distributions for the 1 005 candidate encounters with β Pic that had dmin < 6 pc, calculated using the method described in Sect. 3.1. The horizontal red line marks the 6 pc limit used to select these sources based on their dmin values (middle panel of Fig. 1). Distributions with d50 values above this line correspond to the 47 more distant, higher-dispersion encounters. The horizontal green line denotes the 2 pc critical radius. The orange points indicate the β PMG members. Bottom: same but for the 96 sources with d50 < 2 pc. The Hill sphere of β Pic is highlighted in grey. Only 49 stars have at least a 95% empirical probability of passing within 2 pc of β Pic and are considered actual encounters (highlighted in pink).
Current usage metrics show cumulative count of Article Views (full-text article views including HTML views, PDF and ePub downloads, according to the available data) and Abstracts Views on Vision4Press platform.
Data correspond to usage on the plateform after 2015. The current usage metrics is available 48-96 hours after online publication and is updated daily on week days.
Initial download of the metrics may take a while.