Fig. 4
Download original image
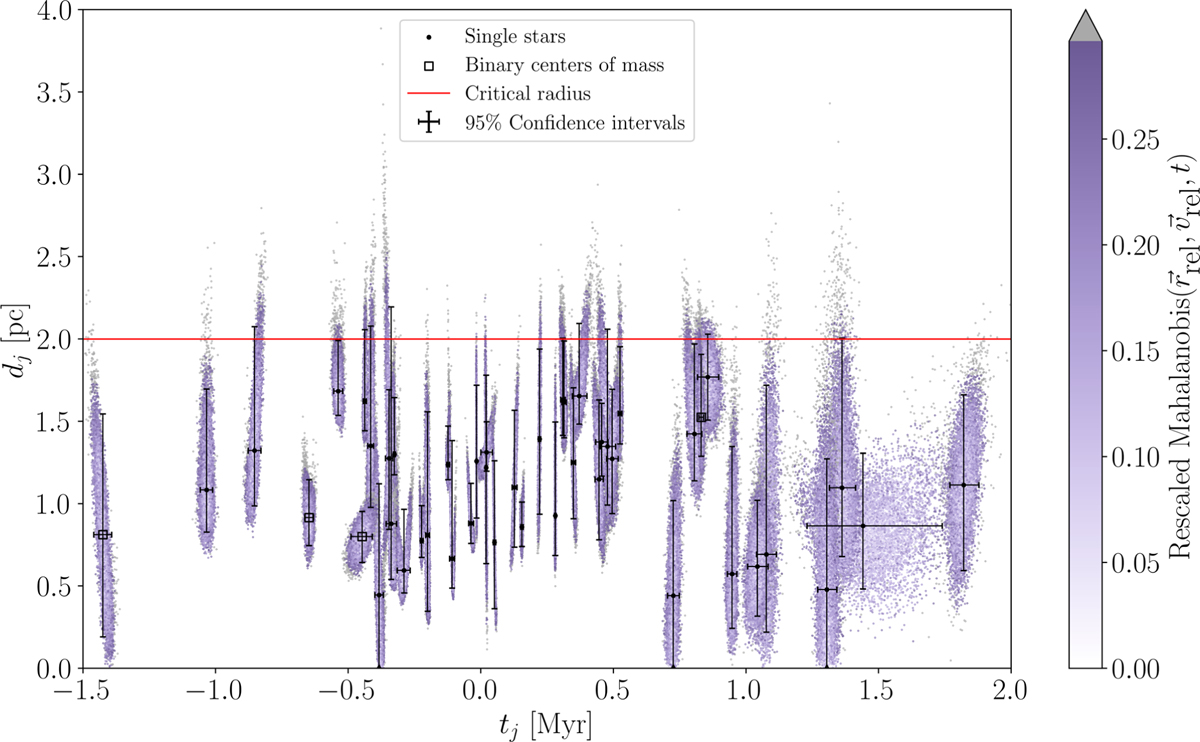
Distance versus time distributions for the 49 encounters with β Pic that have an empirical probability of at least 95% of occurring within 2 pc. The coloured points indicate the rescaled Mahalanobis distances (ensuring a common colour scale for all stars) derived from the encounter parameters. Points above the 95th percentile of this metric are shown in grey. The black bars represent the 95% confidence intervals in time and distance, obtained from the 2.5th and 97.5th percentiles of the corresponding marginal distributions for the further encounters and using the 95th percentile to define the one-tailed distance interval for the closest ones. The central points are the 50th percentiles. The critical radius of 2 pc is indicated by the red horizontal line. The centres of mass of binary systems, listed in Table 3, are marked at the pair [t50, d50] corresponding to that star.
Current usage metrics show cumulative count of Article Views (full-text article views including HTML views, PDF and ePub downloads, according to the available data) and Abstracts Views on Vision4Press platform.
Data correspond to usage on the plateform after 2015. The current usage metrics is available 48-96 hours after online publication and is updated daily on week days.
Initial download of the metrics may take a while.