Fig. 1
Download original image
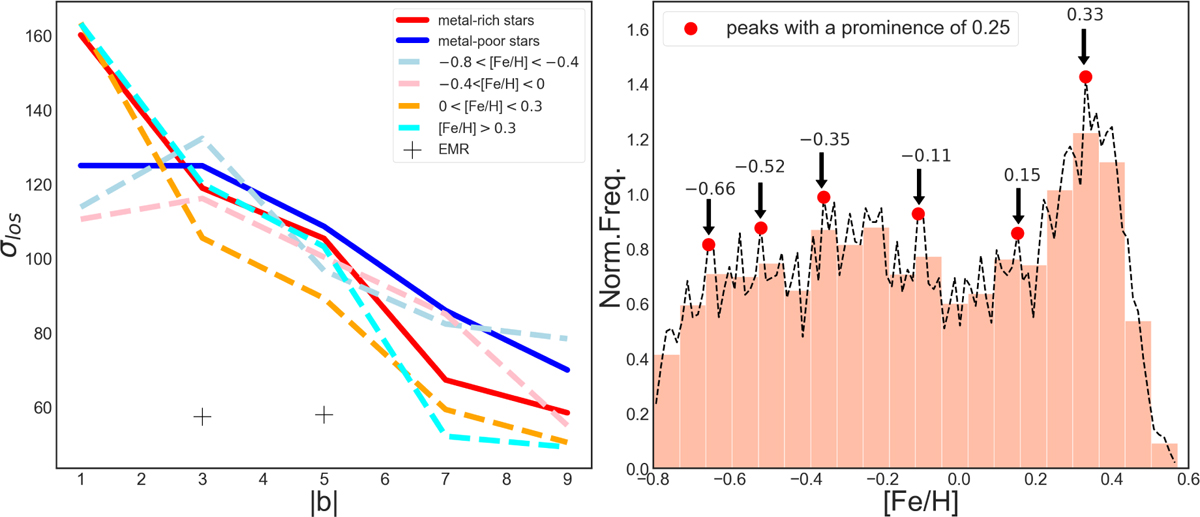
Left panel: line-of-sight velocity dispersions (in units of km/s) across 0 < |b| < 10° along the minor axis (|l| < 2°) of the bulge. The solid red and blue lines represent metal-rich and metal-poor stars, respectively. The dashed lines represent the metal-rich and metal-poor subsamples, while the black cross indicates EMR stars. Right panel: MDF of bulge. Six peaks have been identified with a prominence of 0.25, as indicated by the black arrows.
Current usage metrics show cumulative count of Article Views (full-text article views including HTML views, PDF and ePub downloads, according to the available data) and Abstracts Views on Vision4Press platform.
Data correspond to usage on the plateform after 2015. The current usage metrics is available 48-96 hours after online publication and is updated daily on week days.
Initial download of the metrics may take a while.