Fig. 4
Download original image
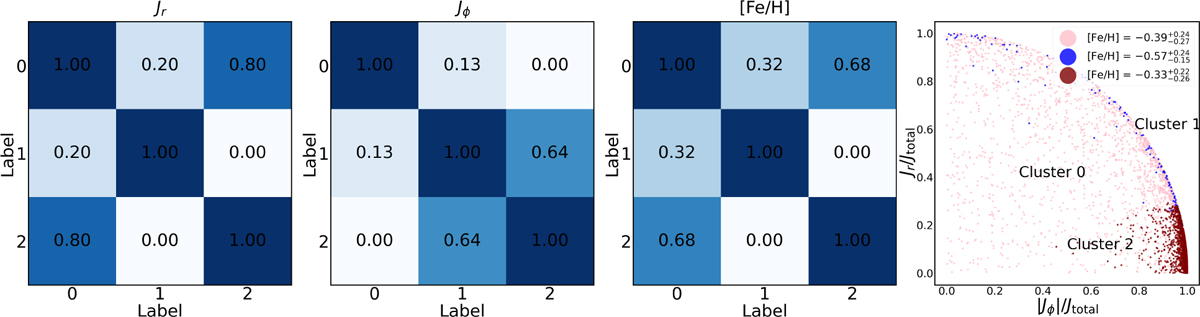
Heat map illustrates similarity of the three clusters based on the distributions of Jr, Jz, and [Fe/H]. The rightmost panel shows the distributions of the three clusters in the Jr/Jtotal–|Jϕ|/Jtotal plane, with the median, 16th percentile, and 84th percentile of [Fe/H] for each cluster indicated in the legend. Cluster 0 has a wide span in the plane and could potentially be clustered into smaller groups when additional quantities are considered. Cluster 1 is the most metal-poor and is supported by both radial and rotational motion. Cluster 2 is the least metal-poor and is mainly supported by rotational motion.
Current usage metrics show cumulative count of Article Views (full-text article views including HTML views, PDF and ePub downloads, according to the available data) and Abstracts Views on Vision4Press platform.
Data correspond to usage on the plateform after 2015. The current usage metrics is available 48-96 hours after online publication and is updated daily on week days.
Initial download of the metrics may take a while.