Fig. 1
Download original image
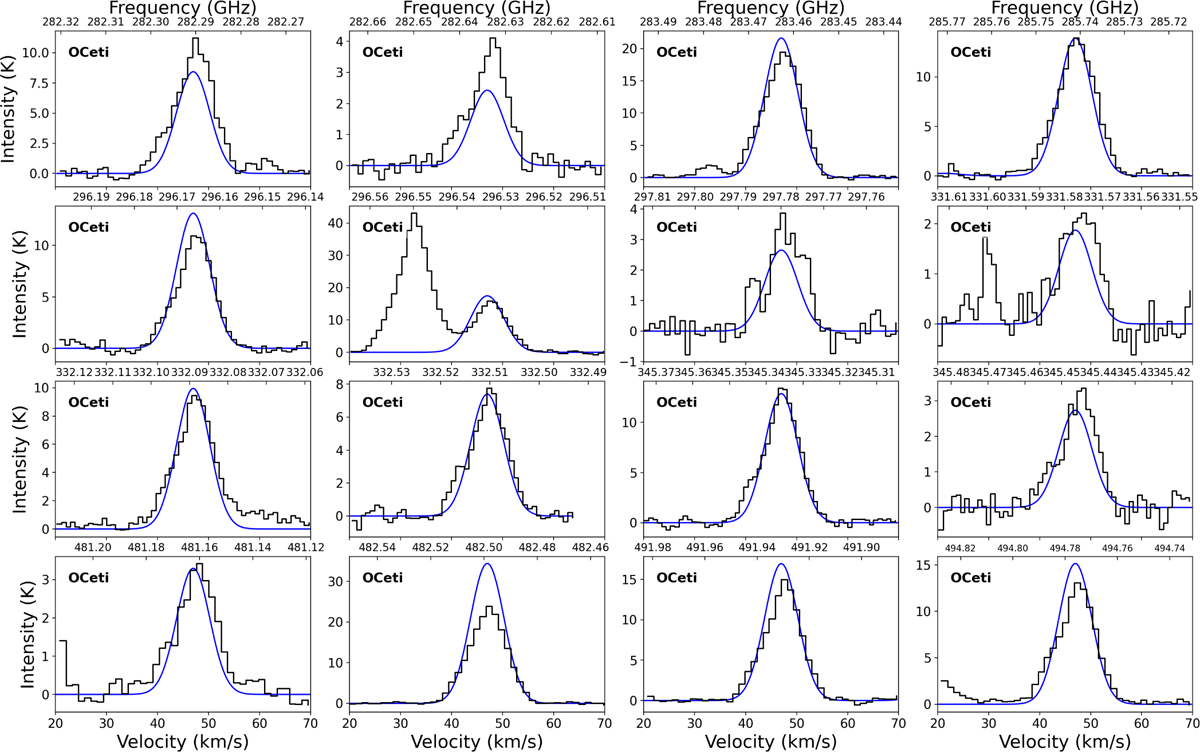
Observed and modelled spectra of SO2 transitions towards o Ceti. The black line represents the observed spectrum, while the blue line represents the modelled spectrum. The strong line at 296.5500 GHz, shown in the second subplot of the third row from the bottom, represents the SO line. The narrow line in the last subplot of the same row corresponds to TiO2 (331.5996 GHz).
Current usage metrics show cumulative count of Article Views (full-text article views including HTML views, PDF and ePub downloads, according to the available data) and Abstracts Views on Vision4Press platform.
Data correspond to usage on the plateform after 2015. The current usage metrics is available 48-96 hours after online publication and is updated daily on week days.
Initial download of the metrics may take a while.