Fig. C.8
Download original image
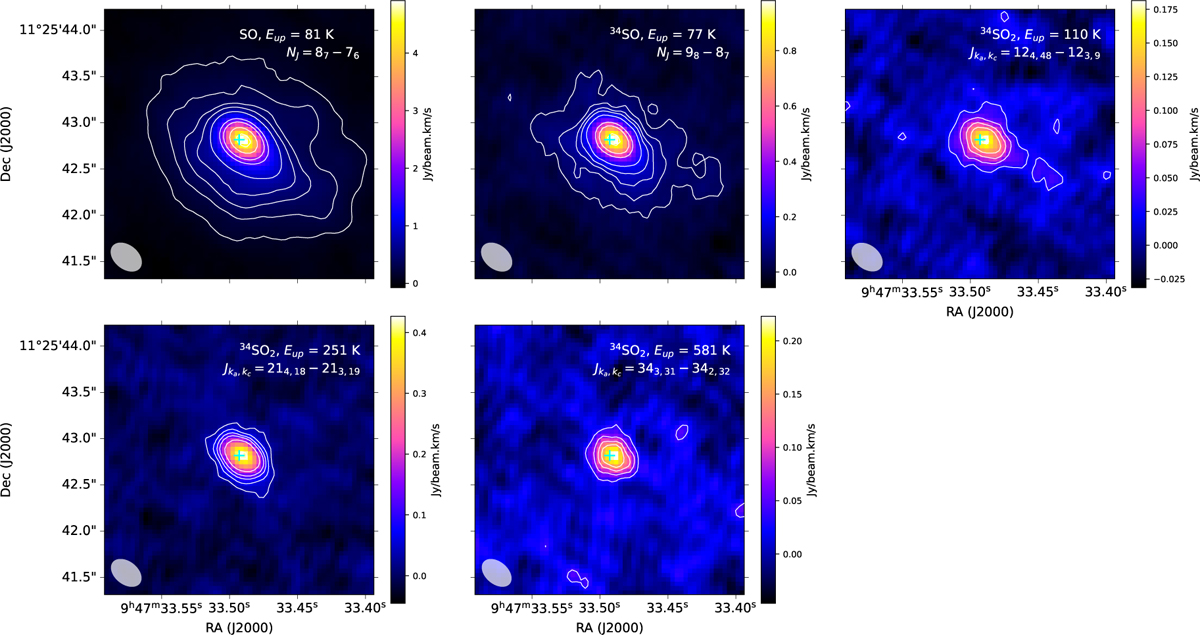
Moment 0 maps of SO, 34SO, and 34SO2 transitions towards R Leo using ALMA 12m array observations. Contours are drawn with steps of 3σ, 6σ, 9σ, 12σ, 18σ, 36σ, 48σ, 72σ, and 96σ. The beam size is shown at the lower left corner of each subplot as a filled grey ellipse. The cyan cross symbol indicates the position of the continuum peak.
Current usage metrics show cumulative count of Article Views (full-text article views including HTML views, PDF and ePub downloads, according to the available data) and Abstracts Views on Vision4Press platform.
Data correspond to usage on the plateform after 2015. The current usage metrics is available 48-96 hours after online publication and is updated daily on week days.
Initial download of the metrics may take a while.