Fig. 2.
Download original image
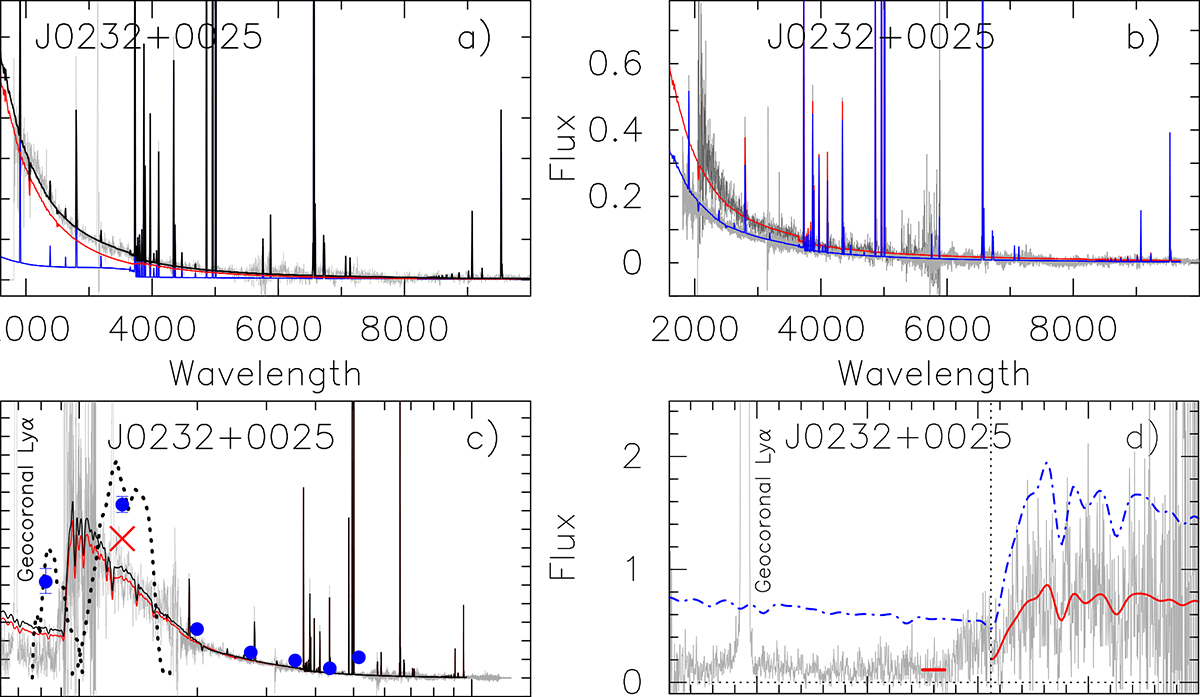
(a) Extinction-corrected rest-frame Xshooter spectrum of J0232+0025 (grey line) overlaid with modelled SEDs. Nebular, stellar, and total (nebular+stellar) SEDs are represented by blue, red, and black lines, respectively. (b) Observed rest-frame SDSS (black line) and Xshooter (grey line) spectra of J0232+0025 overlaid with their corresponding attenuated modelled SEDs (the SDSS spectrum shown in red and the Xshooter spectrum shown in blue). (c) Observed rest-frame COS, STIS, and Xshooter spectra of J0232+0025 (grey lines) overlaid with modelled SEDs attenuated by adopting either R(V) = 3.1 (black line) and R(V) = 2.7 (red line), assuming the Cardelli et al. (1989) reddening law. Blue-filled circles denote GALEX FUV and NUV, and SDSS u, g, r, i, z photometric data. The red cross indicates the NUV flux calculated from the SED by adding the Lyα emission with an EW(Lyα) = 108 Å from the STIS spectrum. Dotted black lines indicate GALEX FUV and NUV response curves reduced to the J0232+0025 rest-frame. (d) Observed COS spectrum of J0232+0025 (grey line) overlaid with the intrinsic modelled SED (dash-dotted blue line) and the SED attenuated with R(V) = 2.7. The short horizontal red line represents the level of the LyC stellar continuum, and the vertical dotted line indicates the location of the LyC limit at 912 Å.
Current usage metrics show cumulative count of Article Views (full-text article views including HTML views, PDF and ePub downloads, according to the available data) and Abstracts Views on Vision4Press platform.
Data correspond to usage on the plateform after 2015. The current usage metrics is available 48-96 hours after online publication and is updated daily on week days.
Initial download of the metrics may take a while.