| Issue |
A&A
Volume 704, December 2025
|
|
|---|---|---|
| Article Number | A19 | |
| Number of page(s) | 17 | |
| Section | Extragalactic astronomy | |
| DOI | https://doi.org/10.1051/0004-6361/202556004 | |
| Published online | 26 November 2025 | |
A great diversity of spectral shapes in the ionising spectra of z ∼ 0.6–1 galaxies revealed by HST/COS and possible detection of nebular LyC emission
1
Bogolyubov Institute for Theoretical Physics, National Academy of Sciences of Ukraine, 14-b Metrolohichna str., Kyiv 03143, Ukraine
2
Observatoire de Genève, Université de Genève, 51 Ch. des Maillettes, 1290 Versoix, Switzerland
3
IRAP/CNRS, 14, Av. E. Belin, 31400 Toulouse, France
4
VDI/VDE Innovation+Technik GmbH, Steinplatz 1, 10623 Berlin, Germany
5
The Kavli Institute for Cosmology (KICC), University of Cambridge, Madingley Road, Cambridge CB3 0HA, UK
6
Cavendish Laboratory, University of Cambridge, 19 JJ Thomson Avenue, Cambridge CB3 0HE, UK
7
Astronomy Department, University of Texas at Austin, 2515 Speedway, Stop C1400 Austin, TX 78712-1205, USA
⋆ Corresponding author: This email address is being protected from spambots. You need JavaScript enabled to view it.
Received:
18
June
2025
Accepted:
3
October
2025
Abstract
We present observations of eleven compact star-forming galaxies in the redshift range z = 0.6145–1.0053, with the Cosmic Origins Spectrograph (COS) on board the Hubble Space Telescope (HST). We aim to spectroscopically measure for the first time the Lyman continuum (LyC) over a wider rest-frame wavelength range of ∼600–900 Å compared to ∼850–900 Å in previous studies of galaxies at z ∼ 0.3–0.4. The HST data are supplemented by SDSS spectra of all galaxies and by a VLT/Xshooter spectrum of one galaxy, J0232+0025. These data are used to derive the spectral energy distribution in the entire UV and optical range, the stellar mass, and the chemical composition from the nebular emission lines. We detect stellar LyC emission in seven out of eleven galaxies with escape fractions, fesc(LyC), in the range of ∼2–60%, and establish upper limits for fesc(LyC) in the remaining galaxies. We discover for the first time nebular LyC emission as a bump just bluewards of the LyC limit at 912 Å in two galaxies, J0232+0025 and J1021+0436. We find a similar bump among our earlier studies in a less distant galaxy J1243+4646 with z = 0.4317. We conclude that the use of the LyC continuum in the wavelength range close to the LyC limit, which contains both the stellar and nebular continua, requires special consideration to not overestimate the observed fesc(LyC).
Key words: galaxies: abundances / galaxies: dwarf / galaxies: fundamental parameters / galaxies: ISM / galaxies: starburst / dark ages / reionization / first stars
© The Authors 2025
 Open Access article, published by EDP Sciences, under the terms of the Creative Commons Attribution License (https://creativecommons.org/licenses/by/4.0), which permits unrestricted use, distribution, and reproduction in any medium, provided the original work is properly cited.
This article is published in open access under the Subscribe to Open model. This email address is being protected from spambots. You need JavaScript enabled to view it. to support open access publication.
1. Introduction
Star-forming galaxies (SFGs) are considered important contributors to the reionisation of the Universe at redshift z ≳ 6. It has been suggested that, at these redshifts, SFGs were responsible for the major part of the ionising radiation (Ouchi et al. 2009; Wise & Cen 2009; Mitra et al. 2013; Yajima et al. 2011; Bouwens et al. 2015; Finkelstein et al. 2019; Lewis et al. 2020; Meyer et al. 2020; Trebitsch et al. 2020; Chisholm et al. 2022). However, to achieve this, their ionising photon production and the escape fraction of the Lyman continuum (LyC) should be ξion ∼ 1025.2 Hz erg−1 and ≳10%, respectively (e.g. Ouchi et al. 2009; Robertson et al. 2013; Dressler et al. 2015; Robertson et al. 2015; Khaire et al. 2016). On the other hand, the role of active galactic nuclei (AGN) in reionisation is less clear (e.g. Finkelstein et al. 2019; Madau et al. 2024).
The observations of escaping hydrogen ionising emission in galaxies at z ≳ 4 are virtually impossible because of the faintness of the galaxies and the high opacity of the partially ionised intergalactic medium (Inoue et al. 2014; Worseck et al. 2014; Robertson 2022). The LyC escape fraction can be sufficient for reionisation, provided that the SFGs at z ≳ 6 responsible for reionisation are similar to these lower-redshift galaxies (Vanzella et al. 2015; de Barros et al. 2016; Shapley et al. 2016; Bian et al. 2017; Vanzella et al. 2018; Rivera-Thorsen et al. 2019; Saha et al. 2020; Vielfaure et al. 2020; Marchi et al. 2017, 2018; Steidel et al. 2018; Begley et al. 2022; Griffiths et al. 2022; Saxena et al. 2022; Kim et al. 2023; Liu et al. 2023; Dhiwar et al. 2024; Kerutt et al. 2024).
Low-mass compact SFGs at z ≲ 1 are considered local proxies of high-redshift LyC leaking galaxies. Many of these galaxies at z ∼ 0.1–0.3 are named ‘Green Pea’ (GP) galaxies because of their intense green colour in SDSS images (Cardamone et al. 2009), while others are classified as ‘luminous compact galaxies’ (LCG) over a wider redshift range z = 0.02–0.63, selected from both the SDSS images and spectra (Izotov et al. 2011). Indeed, Izotov et al. (2015, 2021b) and Brinchmann (2023) compared various properties of high-redshift SFGs with those of low-redshift compact SFGs and found that they are very similar. In particular, stellar masses, star formation rates (SFR), and O32 = [O III]λ5007/[O II]λ3727 ratios of compact SFGs overlap with those of high-redshift SFGs in wide ranges of parameters. Recent James Webb Space Telescope (JWST) spectroscopic observations of z ∼ 8 SFGs have revealed that their chemical composition is similar to that of local SFGs (e.g. Schaerer et al. 2022). Witstok et al. (2021), Rhoads et al. (2023), Matthee et al. (2023), Harshan et al. (2024), and Arellano-Córdova et al. (2025) have also shown that high-redshift galaxies have properties similar to those of GPs at z ≲ 0.3.
HST/COS observations of a large number of compact SFGs at redshifts z ∼ 0.3–0.5 in a wide range of stellar masses and O32 ratios have been obtained by Izotov et al. (2016a,b, 2018a,b, 2021a, 2022), Malkan & Malkan (2021), Flury et al. (2022a,b), and Xu et al. (2022). According to the authors, many of these galaxies leak LyC emission, with an escape fraction of up to 72%. However, we note that all measurements of LyC emission in galaxies at z = 0.3–0.5 were done near the Lyman limit, within a narrow rest-frame wavelength range between 800–900 Å (only part of which is usable due to residual geocoronal emission in the HST spectra). In this range, the contribution from nebular emission – originating from the recombination of the free electron on the hydrogen ground state – and contamination by the geocoronal Lyα and O Iλ1300 emission lines can be important, potentially causing the derived fesc(LyC) to be overestimated (Inoue 2010; Simmonds et al. 2024; Worseck et al. 2014, 2016; Makan et al. 2021). We take a huge effort to minimise geocoronal contamination (scattered light), for example by comparing with orbital night data. Geocoronal emission sets usable wavelength ranges in the LyC, depending on the redshift. The HST observations of galaxies at lower redshifts, z < 0.1, (Leitherer et al. 2016; Komarova et al. 2024) also indicate that they are LyC leaking objects. Furthermore, the Lyα profiles in the spectra of most of these galaxies have double-peaked profiles with a small velocity separation between the peaks, indicating low H I column densities and therefore high escape fractions (Verhamme et al. 2015; Henry et al. 2018; Chisholm et al. 2020; Gazagnes et al. 2020; Izotov et al. 2016a,b, 2018a; b, 2021a, 2022).
In this paper, we extend the redshift range of LyC leakers observed with the HST/COS to z ∼ 0.6–1.0. The goal of these observations is two-fold: (1) to determine the LyC escape fraction fesc(LyC) from the measurement of the LyC emission in the wavelength range free of nebular emission, as well as from a measurement that includes both stellar and nebular emission; and (2) to study the shape of both the stellar and nebular LyC continua in galaxies with detected emission in a large range of wavelengths from ∼600–900 Å (to be addressed in a forthcoming paper). To this end, we analyse new HST/COS observations of the LyC in 11 compact SFGs. The selection criteria are presented in Section 2. The HST/COS and HST/STIS observations and data reduction are described in Sections 3.1 and 3.2. The surface brightness (SB) profiles in the NUV band are discussed in Section 4. The properties of the galaxies derived from the observations in the optical range are considered in Section 5. The comparison of the HST/COS spectra with the extrapolation of the modelled SEDs to the UV range is made in Section 6. The escaping LyC emission is discussed in Section 7 together with the corresponding escape fractions. The likely detection of nebular LyC emission in two galaxies is presented in Section 8. The indirect indicators of escaping LyC emission are considered in Section 9. We summarise our findings in Section 10.
To derive absolute magnitudes and other integrated parameters, we adopted luminosity and angular size distances (Wright 2006) with the cosmological parameters H0 = 67.1 km s−1 Mpc−1, ΩΛ = 0.682, and Ωm = 0.318 (Ade et al. 2014). These distances are presented in Table 1.
Coordinates, redshifts, distances, and integrated characteristics of selected galaxies.
2. Selection criteria
The eleven galaxies in the redshift range z = 0.6145 − 1.0053 for observations with the HST are selected from the SDSS data release 16 (Ahumada et al. 2020). They satisfy the following conditions: 1) The hydrogen emission lines Hδλ4102, Hγλ4340, Hβλ4861, and the oxygen emission lines [O III] λ4959, 5007Å are strong, and the [O III] λ4363 line is detected; these are used to determine oxygen abundance, expressed as 12+log(O/H). In particular, the equivalent width of the [O III] λ5007 emission line is above 400 Å, and this line is detected with a signal-to-noise ratio (S/N) above 20. We note that the Hαλ6563 emission line is not observed because it is outside the wavelength range of the SDSS spectrum. 2) The selected galaxies are the brightest compact SFGs in the adopted redshift range, have the highest O32 ratios, and have the highest equivalent widths EW(Hβ) of the Hβ emission line. This condition is required in order for the LyC to be bright enough to detect. These galaxies are listed in Table 1. Despite the larger redshifts, they have properties similar to those of LyC leakers at lower redshifts (Izotov et al. 2016a,b, 2018a,b, 2020, 2021a, 2022; Flury et al. 2022a).
However, at variance with previous lower-redshift observations, the redshift of the selected galaxies is too high to observe the Lyα emission line with the COS far ultraviolet (FUV) medium-resolution gratings, precluding the possibility to resolve its profile. The angular full widths at half maximum (FWHM) of the selected galaxies in the SDSS g-band images range from 1 1–1
1–1 6, which is much smaller than the 2
 5 diameter COS aperture, allowing the detection of all galaxy UV emission. The SDSS and apparent GALEX magnitudes of the selected galaxies are shown in Table A.1.
3. Observations
3.1. HST/COS observations
HST/COS spectroscopy of the selected galaxies was obtained in programmes GO 16271 and GO 17171 (PI: D. Schaerer) during the periods June 2021 – April 2022 and April 2023 – December 2024, respectively (Table 2). The galaxies were acquired by COS near ultraviolet (NUV) imaging. The brightest NUV region of each target was centred in the  diameter spectroscopic aperture (Fig. 1). The HST acquisition sequence failed for J1450+3913 and for the second visit of J1021+0436 (Table 2), possibly degrading their spectrophotometric quality due to the vignetting of the COS aperture.
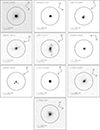 |
Fig. 1. HST COS/NUV acquisition images of the candidate LyC leaking galaxies on a surface brightness scale. The COS spectroscopic aperture with a diameter of 2 |

HST/COS observations.
The spectra were obtained with the grating G140L in the 800 Å setup (wavelength range 770–1950 Å, covering the redshifted LyC emission for all targets). The spectra of J0232+0025 and J1450+3913 were obtained at COS Lifetime Position 4 (resolving power R ≃ 1250 at 1500 Å for a point source or compact galaxy), while the rest of the spectra were recorded at COS Lifetime Position 3, where the different light path yields a higher resolution (R ≃ 2400 at 1500 Å). Typically, the G140L sub-exposures were taken at all four focal-plane offset positions to correct for COS detector blemishes except for the observations of four targets (Table 2), which suffered from COS (re-)acquisition failures (i.e. shortened exposure time). However, the quality of the co-added spectra is still sufficient for our main scientific purpose.
After completion of the HST programmes the individual exposures were reduced with contemporary versions of the CALCOS pipeline (v3.3.10 for GO 16271 and v3.4.4 for GO 17171) and associated calibration files, followed by accurate background subtraction and co-addition with FAINTCOS (Makan et al. 2021). We used the same methods as, for example in Izotov et al. (2018a,b), but chose slightly different extraction apertures (GO 16271: 25 pixels and GO 17171: 29 pixels) to preserve the accuracy of the flux calibration at the longest wavelengths for the highest-redshift targets. Moreover, due to infrequent monitoring of the COS dark current at the COS detector voltage used for G140L observations for GO 17171, we used a large base set of 139 dark exposures taken during the whole observing period and covering a range of orbital conditions to estimate the dark current in the extraction aperture with FAINTCOS. By doing so, we assumed that the COS detector suffers negligible gain sag in the extraction aperture over the observing period (21 months). Still, the minor adjustments in data processing between the two HST/COS programmes do not significantly change our results. The accuracy of our custom correction for scattered light in the COS G140L data was verified by comparing the LyC fluxes obtained in total exposure and in orbital night. We find good agreement between the two sets of measurements.
Statistical Poisson uncertainties for the reduced spectra were determined using the approach by Feldman & Cousins (1998), as described in Worseck et al. (2016) and Makan et al. (2021). We also included estimates of the systematic error stemming from background uncertainties using Monte Carlo simulations, as described in Worseck et al. (2016) and Makan et al. (2021). The reason for this is that Feldman & Cousins (1998) assume the background is known (i.e. background uncertainty is zero), which is not the case for our data. For the measured average LyC fluxes in 20 Å bins, we maximised the Poisson likelihood function (e.g. Equation 2 in Makan et al. 2021) and computed statistical uncertainties again using the frequentist method of Feldman & Cousins (1998). The systematic error due to background uncertainties was estimated with Monte Carlo simulations (as in Worseck et al. 2016; Makan et al. 2021). Thus, the approach is the same as for individual pixels of the spectra but accounts for pixel-to-pixel variations in the flatfield, pixel exposure time, and background. In general, systematic errors are small.
3.2. HST/STIS observations
Additionally, for the galaxy J0232+0025 we used public HST/STIS observations with the low-resolution G230L grating (programme GO 17169, PI: D. Schaerer) processed with the HST CALSTIS pipeline. Details of these observations are available in Table 3. The obtained spectrum covers the rest-frame wavelength range from ∼1000–1880 Å. Only a few spectral features are detected in this spectrum, including hydrogen Lyαλ1216Å in emission, Lyβλ1026Å in absorption, C IVλ1549Å exhibiting a P-Cygni profile, and, possibly, a weak stellar O VIλ1035Å line with a likely P-Cygni profile.
HST/STIS observations.
3.3. Results from rest-frame optical spectra
Spectral observations of J0232+0025 in the wavelength range 3000–24 000 Å were carried out with the Xshooter spectrograph mounted at the VLT/UT2 in nodding-on-slit mode during several nights in 2021 (ESO Program ID 0105.20LV.001, PI: D. Schaerer). IRAF was used to reduce the observations, which included subtraction of the bias exposures in the ultraviolet and blue (UVB) and visual (VIS) arms and of the dark exposures in the near-infrared (NIR) arm. Applying the crmedian routine, we removed the cosmic rays. Corrections for pixel sensitivity, background subtraction, wavelength calibration, as well as distortion and tilt of each frame were performed. The 1D spectra were extracted from 2D frames in apertures of 1 6 along the slit for the UVB and VIS arms and 2
 4 for the NIR arm. The flux-calibrated rest-frame spectrum is shown in Fig. A.1. Emission-line fluxes were measured using total integral fluxes with the IRAFsplot routine (Table A.2). For all sources we also measured the line properties from the SDSS spectra using the IRAFsplot routine (Table A.3).
4. Surface brightness distribution in the NUV range
Our galaxies in the COS NUV acquisition images generally have a complex structure and consist of several bright compact regions of star formation, along with an extended low-surface-brightness component. The nature of the extended emission is unclear. However, we note that part of the emission is diffuse Lyα emission, which is more extended than the stellar light (Flury et al. 2022b; Saldana-Lopez et al. 2025). This emission line in our galaxies falls within the NUV range. The SB profiles of our galaxies are derived, using the COS NUV acquisition images and the routine ellipse in IRAF/STSDAS. The profiles were scaled to magnitudes per square arcsec, using the apparent GALEX NUV magnitudes. There is no SB profile for the galaxy J1450+3913 because its acquisition exposure failed, as noted above.
As found previously by Izotov et al. (2016a,b, 2018a,b, 2020, 2021a, 2022), the outer parts of our galaxies are characterised by a linear weakening in SB (in magnitudes per square arcsecond), characteristic of disc structures, while the central part containing bright star-forming region(s) shows a sharp increase in J0232+0025, J0256+0122, J0908+4626, and J1021+0436, which have compact structures. In contrast, a more modest increase is present in the remaining galaxies, which exhibit complex and extended morphology (Figs. 1 and A.2).
The scale lengths α of our galaxies, defined in Eq. (1) of Izotov et al. (2016b), range from ∼0.5–1.0 kpc (Fig. A.2). This is somewhat lower than that in other LyC leakers at lower redshifts with M⋆/M⊙ ∼ 109–1010 (Izotov et al. 2016a,b, 2018a,b) but is higher than that in LyC leakers with lower stellar masses (Izotov et al. 2021a, 2022). The radii r50 ∼ 0.5 kpc of our galaxies (Fig. A.2) and stellar masses are similar to that of galaxies from the LzLCS+ sample (Flury et al. 2022a), which includes all objects observed and analysed earlier by Izotov et al. (2016a,b, 2018a,b, 2021a).
5. Properties of galaxies from optical spectra
5.1. Interstellar extinction
Interstellar extinction was derived from the observed decrement of all available hydrogen emission lines, which are measurable in the SDSS spectra of all galaxies and in the Xshooter spectrum of J0232+0025 (Izotov et al. 1994). The emission-line fluxes were corrected for the internal extinction of the galaxies by adopting the Cardelli et al. (1989) reddening law with R(V) = 3.1 and A(V) = 3.1 × E(B − V), where E(B − V) = C(Hβ)/1.47 (Aller 1984). The fluxes of hydrogen emission lines were corrected for underlying stellar absorption. Differential extinction E(B − V) = 0.0–0.15 in our galaxies is low and is in the range of values obtained by Izotov et al. (2016a,b, 2018a,b, 2021a) and Chisholm et al. (2022) for LyC leaking galaxies. We note that the Hα emission line is observed only in the Xshooter spectrum of J0232+0025 (Table A.2), whereas this line is outside the wavelength range of the SDSS spectra because of the high redshift (Table A.3). The extinction-corrected emission line fluxes were used to derive ionic and total element abundances following the methods described in Izotov et al. (2006) and Guseva et al. (2013).
The emission-line fluxes I(λ)/I(Hβ) corrected for extinction, rest-frame equivalent widths (EW), extinction coefficient C(Hβ), and observed Hβ fluxes in the SDSS spectra are shown in Table A.3. Corresponding quantities for J0232+0025 obtained from the Xshooter spectrum are shown in Table A.2.
5.2. Physical conditions and element abundances
The fluxes and the direct Te method were used to derive the electron temperature, the electron number density, and the abundances of O, Ne, and Mg from the SDSS spectra and those of O, C, N, Ne, Mg, S, and Ar from the Xshooter spectrum. These quantities for the SDSS spectra are shown in Table 4; corresponding quantities for the Xshooter spectrum of J0232+0025 are shown in Table 5. The electron temperatures Te(O III) and Te(O II) derived from the Xshooter spectrum of J0232+0025 are higher than in the SDSS spectrum, but are consistent within the errors. We note that the errors in the electron temperatures derived from the SDSS spectra are high, reaching up to ∼30% of their values (Table 4). This results in relatively high errors in the element abundances. On the other hand, the error in the electron temperature derived from the Xshooter spectrum of J0232+0025 is much lower (Table 5). We also note that the SDSS spectra do not cover the wavelength range containing [S II] λλ6717,6731Å emission lines due to the high redshift. Fortunately, the electron temperature and element abundances are almost independent of Ne if the number densities are ≲104 cm−3, which is expected in our galaxies. Despite these differences and assumptions, the agreement between the 12 + logO/H, log Ne/O and log Mg/O from the SDSS and Xshooter spectra of J0232+0025 are good. The oxygen abundances of the galaxies studied here are comparable to those in known low-redshift LyC leakers by Izotov et al. (2016a,b, 2018a,b) and Flury et al. (2022a). The ratios of the α-element (neon, magnesium, sulphur, and argon) abundances to oxygen abundance are similar to those in dwarf emission-line galaxies (e.g. Izotov et al. 2006; Guseva et al. 2013; Arellano-Córdova et al. 2024; Zinchenko et al. 2025; Esteban et al. 2025). The carbon-to-oxygen abundance ratio in J0232+0025 is similar to that in low-redshift SFGs (e.g. Izotov & Thuan 1999; Berg et al. 2016, 2019; Izotov et al. 2023), whereas the nitrogen-to-oxygen abundance ratio in J0232+0025 is somewhat elevated compared to that of nearby SFGs (e.g. Arellano-Córdova et al. 2025), but similar to that in other LyC leakers at z ≳ 0.3 (e.g. Izotov et al. 2023). It is derived from the Xshooter spectrum. No carbon and nitrogen abundances are available from SDSS spectra for this and other galaxies, since the C III] λ1909 and [N II] λ6584 emission lines are outside the wavelength range of the SDSS spectra.
Electron temperatures, electron number densities, and element abundances in H II regions derived from SDSS spectra.
Electron temperatures, electron number density, and element abundances obtained from the Xshooter spectrum of J0232+0025.
5.3. Absolute magnitudes, Hβ luminosities, and star formation rates
We derived absolute magnitudes from the fluxes of the extinction-corrected optical spectral energy distribution (SED), extrapolated to the rest-frame wavelength of λ = 1500 Å. We designate these absolute magnitudes as MFUV (Table 1).
The Hβ luminosity L(Hβ) and the corresponding SFRs were obtained from the extinction-corrected Hβ fluxes, using the relation of Kennicutt (1998) for the SFR. Here fesc(LyC) was derived from the stellar LyC fluxes in the regions where the contribution of nebular LyC emission is low, and we discuss in Sects. 7 and 8 how fesc depends on this choice. The SFRs were multiplied by a factor of 1/[1–fesc(LyC)] to correct for escaping LyC radiation and are shown in Table 1. This factor holds for the H II region with an isotropic distribution of the neutral gas; however, it may be considerably lower if LyC escape is anisotropic. The derived SFRs are several times higher than SFRs for other LyC leakers studied by Izotov et al. (2016a,b, 2018a,b, 2021a, 2022) and Flury et al. (2022a,b).
5.4. Spectral energy distributions and stellar masses
We used the SDSS spectra of our LyC leakers to fit the SED and derive their stellar masses. The fitting method, using a two-component model, is described for example in Izotov et al. (2018a,b). The star formation history was approximated by a young instantaneous burst with a randomly varying age tb (< 10 Myr), and by continuous star formation at older ages between t1 and t2 (t1 < t2), both randomly varying within the range 10 Myr – 10 Gyr. For stellar populations, we adopted STARBURST99 models (Steidel et al. 1999).
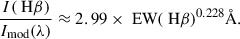
The emission of the nebular continuum at λ > 1000 Å (Aller 1984), including free-free and free-bound hydrogen and helium emission, and two-photon emission, was also accounted for using the observed Hβ flux, as well as the temperature and density of the H II region. The fraction of nebular emission in the observed continuum near Hβ was determined from the ratio of the observed Hβ equivalent width EW(Hβ)obs, reduced to the rest-frame, to the equivalent EW(Hβ)rec = ϵ(Hβ)rec/ϵff(4861) for pure nebular emission, where ϵ(Hβ)rec and ϵff(4861) are emissivities of the recombination Hβ emission line and the monochromatic free-free emission at the wavelength of 4861 Å, respectively. The EW(Hβ)rec does not depend on the electron number density and is only slightly dependent on the electron temperature, varying from ∼1100 Å at Te = 10 000 K to ∼900 Å at Te = 20 000 K (Aller 1984). Recently, Schaerer et al. (2025) obtained similar values of EW(Hβ)rec, ranging from ∼1200 Å at Te = 10 000 K to ∼800 Å at Te = 20 000 K. A χ2 minimisation technique was used firstly to fit the continuum in the wavelength range 2500–6000 Å, and secondly to reproduce the observed Hβ equivalent width.
The stellar (red lines), nebular (blue lines), and total (black lines) SEDs superposed on the extinction-corrected rest-frame spectra (grey lines) are shown in Fig. A.3. The total SEDs reproduce energy distributions in observed spectra at λ > 3000 Å. On the other hand, the observed spectra at shorter wavelengths in five of the eleven galaxies lie above the modelled total SEDs, likely due to issues with the flux calibration of the SDSS spectra.
6. Comparison of the HST/COS spectra with the modelled SEDs in the UV range
To derive the fraction of escaping ionising radiation, we used two methods based on a comparison between the observed flux in the LyC range and the intrinsic flux produced by stellar populations in the galaxy. The intrinsic LyC flux can be obtained either from SED fitting of the SDSS spectra or from the flux of the Hβ emission line. To verify the quality of our SED fitting, we extrapolate the attenuated SEDs to the UV range and compare them with the observed COS spectra in Fig. A.4. For comparison, we also show with blue-filled circles the GALEX FUV and NUV fluxes, along with the fluxes in the SDSS u, g, r, i, z bands.
We find that the spectroscopic and photometric data in the optical range are consistent, indicating that almost all the continuum emission of our galaxies is inside the spectroscopic aperture. Therefore, aperture corrections are not needed. On the other hand, considerable deviations of the attenuated SED extrapolations to brighter values from the observed COS spectra are found for the galaxy J1450+3913, which had a failed acquisition exposure.
Compared to the SDSS spectrum of J0232+0025, the Xshooter spectrum of this galaxy has a significantly higher signal-to-noise ratio and a wider wavelength coverage, including the Hα emission line, which is redshifted out of the SDSS bandpass for all of the studied galaxies. This allows a better determination of emission line fluxes, extinction, and the SED. These data are compared with the corresponding data obtained from the SDSS spectrum of J0232+0025.
In Fig. 2a, we show stellar (red line), nebular (blue line), and total (black line) SEDs obtained from the extinction-corrected Xshooter spectrum of J0232+0025 (grey line). As shown, the total SED (black line) reproduces the observed spectrum (grey line) very well.
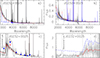 |
Fig. 2. (a) Extinction-corrected rest-frame Xshooter spectrum of J0232+0025 (grey line) overlaid with modelled SEDs. Nebular, stellar, and total (nebular+stellar) SEDs are represented by blue, red, and black lines, respectively. (b) Observed rest-frame SDSS (black line) and Xshooter (grey line) spectra of J0232+0025 overlaid with their corresponding attenuated modelled SEDs (the SDSS spectrum shown in red and the Xshooter spectrum shown in blue). (c) Observed rest-frame COS, STIS, and Xshooter spectra of J0232+0025 (grey lines) overlaid with modelled SEDs attenuated by adopting either R(V) = 3.1 (black line) and R(V) = 2.7 (red line), assuming the Cardelli et al. (1989) reddening law. Blue-filled circles denote GALEX FUV and NUV, and SDSS u, g, r, i, z photometric data. The red cross indicates the NUV flux calculated from the SED by adding the Lyα emission with an EW(Lyα) = 108 Å from the STIS spectrum. Dotted black lines indicate GALEX FUV and NUV response curves reduced to the J0232+0025 rest-frame. (d) Observed COS spectrum of J0232+0025 (grey line) overlaid with the intrinsic modelled SED (dash-dotted blue line) and the SED attenuated with R(V) = 2.7. The short horizontal red line represents the level of the LyC stellar continuum, and the vertical dotted line indicates the location of the LyC limit at 912 Å. |
In Fig. 2b we compare the observed Xshooter (grey line) and SDSS (black line) spectra with their corresponding total SEDs (red and blue lines). The agreement between the two spectra is good at λ ≳ 4000 Å. However, at shorter wavelengths, the SDSS spectrum lies significantly above the Xshooter spectrum, indicating a problem with the flux calibration of the SDSS spectrum. Consequently, we use the Xshooter spectrum.
In Fig. 2c we compare the attenuated SED and its extrapolation to the UV range (red and black lines for R(V) values of 3.1 and 2.7, respectively) for J0232+0025 with the COS spectrum in the UV range and the Xshooter spectrum in the optical range (grey lines). We find very good agreement between the modelled SEDs and the observed spectra. This contrasts with the large deviation of the SED in the UV range obtained from the SDSS spectrum and the COS spectrum (Fig. 2a). We also note a large offset between the GALEX NUV flux and the SED. This may be partly due to uncertainties in GALEX NUV photometry, although the error bars in Fig. 2c are small. We suspect that the difference between GALEX and SED fluxes in the NUV range is due to the contribution of the Lyα emission line to the GALEX NUV flux. Due to the large redshift of the galaxy, this line is located outside the observed COS spectrum but coincides with the position of maximum transmission of the GALEX NUV filter (dotted line). Adopting an equivalent width measured in the STIS spectrum, EW(Lyα) = 108 Å, we obtain a NUV Lyα plus SED flux (shown by a red cross in Fig. 2c) that is considerably lower than the observed GALEX NUV flux (blue-filled circle). This difference cannot be explained by the small uncertainties in the GALEX NUV magnitude (Table A.1). We suggest that the difference is caused by the presence of the extended Lyα halo in J0232+0025, with a radius several times larger than that of the stellar emission, similar to haloes observed in other SFGs (e.g. Chen et al. 2021; Erb et al. 2023; Runnholm et al. 2023; Trainor et al. 2025). The angular diameter of the region with likely Lyα emission in J0232+0025, of at least 1″ corresponding to a linear diameter of 7.5 kpc, is considerably larger than the slit width of 0 5 used during STIS observations, whereas most of the stellar emission in the NUV band lies within the STIS slit (Fig. 3).
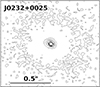 |
Fig. 3. Isophotes of the J0232+0025 COS/NUV acquisition image in arbitrary units but with equal steps. The diameter of the outer isophote is larger than the slit width of 0 |

The expanded version of the J0232+0025 COS spectrum is shown in Fig. 2d. For comparison, we show the extrapolation of the attenuated SED derived from fitting the Xshooter spectrum (red line), which is in good agreement with the observed COS spectrum, and the unattenuated, intrinsic SED (blue line). The short horizontal red line at wavelengths ranging from 850 to 870 Å indicates the flux of the stellar LyC, which is used below to derive the LyC escape fraction.
7. Escaping Lyman continuum radiation
Izotov et al. (2016a,b, 2018a,b, 2021a, 2022) used the ratio of the escaping fluxes Iesc to the intrinsic fluxes Imod of the LyC to derive fesc(LyC):
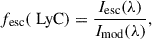 (1)
(1)
where λ is the mean wavelength of the range used for averaging of the LyC flux density (see Table 6). We used two methods to derive the intrinsic fluxes Imod and, correspondingly, the LyC escape fractions fesc(LyC) (Izotov et al. 2016b): 1) from the SED fitting, and 2) from the equivalent width of the Hβ emission line combined with its extinction-corrected flux according to the equation,
 (2)
(2)
LyC escape fraction.
However, we note that the SEDs extrapolated to the UV range in Fig. 2 lie somewhat above the observed COS spectra, excluding J1021+0436 and J1252+5237. On the other hand, the SED derived from the Xshooter spectrum of J0232+0025 is in good agreement with the COS spectrum (Fig. 2c). Therefore, we do not consider the fesc(LyC) derived from SED fitting to be reliable, except for that of J0232+0025, J1021+0436, and J1252+5237. For other galaxies, we consider the fesc(LyC) derived using Hβ emission to be somewhat more reliable, although this method assumes a young instantaneous burst in the galaxy and ignores the contributions from older populations in both the UV and optical ranges.
The absolute escape fractions of LyC photons, fesc(LyC), derived using these two methods and different wavelength ranges in the LyC (see discussion below), are listed in Table 6. We find values of fesc(LyC) ranging from 2 to 60 % for eight out of the eleven galaxies. Among these, three show LyC detections above 3σ (J0232+0025, J1021+0436, and J1252+5237), while four galaxies (J0256+0122, J0815+2942, J0901+5111, and J1450+3913) have only upper limits. We consider the escape fractions fesc(LyC) unreliable for four galaxies (J0837+4512, J0908+4636, J0955+3935, and J1358+4611) with LyC detections below 3σ. We also note that most of the galaxies with non-detected or unreliably detected stellar LyC emission are characterised by irregular morphologies, likely indicating a stellar origin of the extended emission (Fig. 1). In contrast, the galaxy J0232+0025, which has the highest stellar LyC escape fraction, is compact and characterised by symmetric, extended, likely Lyα, emission (Fig. 3).
8. Origin of the LyC bumps
We note interesting emission features (LyC bumps) in the LyC near the Lyman limit in the COS spectra of two galaxies, J0232+0025 and J1021+0436 (Figs. 4a and 4b). A bump in the wavelength range 880–912 Å is observed in the spectrum of J0232+0025, whereas a much broader bump in the wavelength range 820–912 Å is observed in the spectrum of J1021+0436 (magenta lines in Fig. 4). Both galaxies are very compact and symmetric in the COS/NUV acquisition images, unlike the clumpy galaxies from our sample, and no other sources are present inside the COS spectroscopic aperture at angular radii greater than ∼0 1, corresponding to linear radii of ≳0.7–0.8 kpc (Figs. 1, 3). However, we note that a faint source at a distance of 0
 07 from the brightest source, corresponding to the projected distance of ∼0.5 kpc, is present according to the SB distribution of J1021+0436 (Fig. A.2). It could either be located in the galaxy or be a foreground galaxy at z ∼ 0.9. Therefore, we cannot exclude the possibility that the LyC bump in J1021+0436 is unrelated to this galaxy. On the other hand, no sources are seen in the vicinity of J0232+0025 (Figs. 3, A.2), implying that the bump is likely related only to this galaxy.
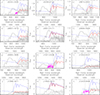 |
Fig. 4. Fragments of smoothed spectra in the LyC region for 11 galaxies at z ∼ 0.6–1.0 (a) – (k) (this paper), and for J1243+4646 (l) from Izotov et al. (2018b). Modelled intrinsic SEDs, attenuated by Milky Way extinction with R(V)MW = 3.1 and internal extinction with R(V)int = 2.7, assuming the Cardelli et al. (1989) reddening law, and the unreddened SEDs are shown by solid red and dash-dotted blue lines, respectively. Emission features at the observed wavelengths λ1216Å and λ1301Å are geocoronal Lyα and O I emission lines, respectively. The parts of the observed spectra containing the LyC bumps for a) J0232+0025, h) J1021+0436, and l) J1243+4646 are highlighted by magenta lines. Dotted black lines in all panels indicate the GALEX FUV response curve reduced to the galaxy rest-frame. The vertical dotted line in all panels indicates the location of the LyC limit at 912 Å. Fluxes are in 10−16 erg s−1 cm−2 Å−1, and wavelengths are in angstrom. |
The sharp decrease in bumps at λ880Å in J0232+0025 and at λ820Å in J1021+0436 might be caused by the presence of intergalactic Lyman limit systems (LLS) at corresponding redshifts of ∼0.73 and ∼0.90. If confirmed, the LLS in the direction of J0232+0025 is likely translucent at rest-frame wavelengths < 912 Å, because LyC emission is detected at λ < 880 Å, whereas it appears opaque in the direction of J1021+0436, as LyC emission is not detected at λ < 820 Å. However, the absence of Mg IIλ2800 LLS absorption features bluewards of the Mg IIλ2800Å emission line in the Xshooter spectrum of J0232+0025 (Fig. A.1) and in the noisier SDSS spectrum of J1021+0436 (Fig. A.3h) may argue either against the presence of an LLS or in favour of its very low metallicity.
It is unlikely that bumps can be explained by the presence of dust because the extinction in both galaxies is very small (Table A.3). Likewise, the extinction in the LyC range smoothly increases with decreasing wavelength, attains a maximum at 720 Å, then decreases with decreasing wavelength (Draine 2003). Additionally, the LyC spectrum of J0232+0025 at λ880Å is smooth and lacks any features related to the maximum in dust extinction at 720 Å.
The smearing of non-ionising galaxy continuum also cannot play a role below 900 Å because the line spread function (LSF) of G140L has a sharp core with high values within ±1 Å, and extended wings with low values. As a result, it is not able to redistribute non-ionising emission to wavelengths below 900 Å.
We suggest that the two bumps are due to nebular LyC emission. They may be connected with the high EW(Hβ) > 200 Å (Table A.3) and thus with a high fraction of nebular continuum (≳20%) near the Hβ emission line. However, we find no evidence of a bump in the spectrum of J0837+4512 (Fig. 4d) with the highest EW(Hβ) of 368 Å (Table A.3). The average monochromatic LyC fluxes in the bumps of J0232+0025 and J1021+0436 are considerably larger than that at shorter wavelengths. However, no such emission is detected in the spectra of the other nine galaxies with similar integrated characteristics (Table 1). The only difference is that the stellar LyC escape fraction in J0232+0025 is considerably higher than in other galaxies (Table 6), implying that the neutral gas in this galaxy is translucent to LyC emission. However, in the spectrum of J1021+0436 no flux is detected in the LyC at wavelengths ≲820 Å.
The properties of nebular LyC bump were first considered by Inoue (2010), who was motivated by the enhanced level of LyC emission just bluewards of the Lyman limit at λ = 912 Å, observed in a number of SFGs at z ∼ 3. He showed that the escaping hydrogen bound-free emission produces a strong bump just below the Lyman limit due to the radiation energy redistribution of stellar LyC by nebulae. The effect depends on the optical depth (or column density) of neutral hydrogen and is maximal at intermediate column densities. The bump is absent at very low neutral hydrogen column densities when the LyC escape fraction is high (fesc(LyC) ∼ 1) and at high neutral hydrogen column densities when fesc(LyC) ∼ 0.
Simmonds et al. (2024) further considered the properties of the nebular LyC bump and found that it is strongest at N(H I) ∼ 1017–1018 cm−2, where escape fractions, calculated as the ratio between the intrinsic stellar spectrum and the emergent LyC stellar plus nebular spectrum over the same wavelength range, are increased by more than a factor of 3, compared to escape fractions of the transmitted stellar spectrum. This implies that some of LyC photons detected in the literature may have a nebular, rather than stellar, origin.
The presence of the nebular LyC emission implies that LyC escape fractions in the LyC leaking galaxies at lower redshifts of 0.3–0.4 might be somewhat overestimated. This is because the LyC flux in galaxies at z ∼ 0.3–0.4 can only be observed and measured in HST/COS spectra at rest-frame wavelengths λ ≳ 870–900 Å near the Lyman limit, where contributions from nebular LyC emission could be important but are not distinguished from stellar emission. Additionally, contamination of LyC emission by geocoronal Lyα emission in galaxies with z ∼ 0.32–0.36 is high. Therefore, the fraction of the LyC leaking galaxies at z < 0.4 with LyC nebular emission is difficult to estimate. However, at higher redshifts, ionising radiation at shorter rest-frame wavelengths can be observed with the HST/COS. To illustrate this, we add in Fig. 4l the spectrum of J1243+4646 at z = 0.4317, which shows one of the highest LyC escape fractions fesc(LyC) ∼ 0.7 derived by Izotov et al. (2018b) near the Lyman limit. This galaxy has the highest redshift z among the galaxies observed by Izotov et al. (2018b); therefore, the HST/COS spectrum extends to shorter wavelengths compared with other galaxies from their sample. Also, the equivalent width of the Hβ emission line in the spectrum of J1243+4646 is above 200 Å, similar to that in the spectra of the two galaxies with the LyC bumps discussed in this paper, and there are no other sources in the vicinity of this galaxy (Figs. 4c and 5c in Izotov et al. 2018b). As seen in Fig. 4l, the LyC continuum is high and nearly constant at λ > 820 Å, then decreases rapidly at shorter wavelengths, similar to the behaviour observed in J0232+0025 (Fig. 4a) and J1021+0436 (Fig. 4h). We also note that the energy distribution of the nebular LyC in all three galaxies in Fig. 4 is nearly constant, whereas the modelled energy distribution (Inoue 2010; Simmonds et al. 2024) has a sharp peak at 912Å and steep decrease at shorter wavelengths. This discrepancy between models and observations warrants detailed investigation in a separate study, which is beyond the scope of this paper. Finally, we note that the total LyC escape fraction predicted using the observed flux ratio F700Å/F1100Å and the expression proposed by Simmonds et al. (2024) from their CLOUDY models, assuming isotropic escape, yields fesc(LyC) ≈ 1 for J0232+0025. This is likely incompatible with the presence of strong emission lines in this galaxy as well as with LyC nebular free-bound emission.
The effect of nebular LyC can likely be seen in distributions between the observed LyC escape fractions and the LyC escape fractions predicted by Jaskot et al. (2024), who use combinations of several global characteristics of low-redshift (z ∼ 0.3–0.4) LyC emitters. Jaskot et al. (2024) developed and analysed new multivariate predictors of fesc(LyC) based on the Cox proportional hazards model, a survival analysis technique that incorporates both detections and upper limits. They found that in strong LyC leakers with fesc(LyC) ≳ 0.2, the predicted escape fractions are systematically lower than the observed ones. Jaskot et al. (2024) suggest that this difference is caused by unaccounted parameter(s), such as the H I covering fraction and anisotropy of LyC escape (see also earlier studies by Zackrisson et al. 2013, 2017; Flury et al. 2022b; Saldana-Lopez et al. 2022). We also suggest that such a difference is due to the contribution of nebular LyC components to the observed fesc(LyC) near the Lyman limit, which is not accounted for in the Jaskot et al. (2024) analysis.
If confirmed, the presence of nebular LyC emission in LyC galaxies is expected to be rare, as its emergence requires special conditions (e.g. Simmonds et al. 2024). In particular, stacks of a large number of LzLCS+ galaxies in the wavelength range 820–900 Å show no evidence of nebular contribution (Flury et al. 2025). The higher EW(Hβ) > 200 Å in all three galaxies with suspected nebular LyC emission, combined with their very compact structure compared to the average LzLCS+ galaxy, may be necessary but apparently not sufficient conditions.
9. Indicators of high LyC escape fraction
Since direct measurements of LyC emission in high-z galaxies are basically unfeasible but of great interest, several indirect methods to determine LyC emission from SFGs at low-redshift have been proposed. These include Jaskot & Oey (2013), Nakajima & Ouchi (2014), Faisst (2016), Izotov et al. (2016a,b, 2018a,b, 2021a), Flury et al. (2022a,b), Jaskot et al. (2024), who determined relations between the LyC escape fraction fesc(LyC) and such various observable or derivable characteristics from the spectra in the UV and optical ranges as stellar mass M⋆, Lyα profile, Lyα escape fraction, and O32 ratio. However, at redshifts greater than 0.6, observing the Lyα profile – the best indicator – is not possible with the HST COS/FUV. On the other hand, such characteristics as M⋆ and O32 obtained from the optical data are available.
In addition to the 11 new LyC measurements presented above, we have a sample of approximately one hundred low-z galaxies with a wide range of O32, up to 29, and directly derived fesc(LyC) (Borthakur et al. 2014; Leitherer et al. 2016; Izotov et al. 2016a,b; Chisholm et al. 2017; Izotov et al. 2018a,b, 2021a, 2022; Flury et al. 2022a,b). The relation between fesc(LyC) and O32 is presented in Fig. 5a. There is a trend of increasing fesc(LyC) with increasing O32, albeit with a substantial scatter. This large scatter is due to the dependence of O32 on other parameters such as metallicity, hardness of ionising radiation, and ionisation (e.g. Izotov et al. 2021a, 2022; Flury et al. 2022b; Reddy et al. 2023). Additionally, the spread of fesc(LyC) can also be due to varying degrees of leakage through channels with low optical depth and to different orientation of these channels relative to the observer’s line of sight. Therefore, a high O32 is not a very certain indicator of high fesc(LyC), and it is only a necessary condition for escaping radiation (e.g. Izotov et al. 2018b; Nakajima et al. 2020). The only firm result from Fig. 5a is that fesc(LyC) is low (< 10%) on average, and that the fraction of LyC non-detections is higher in objects with O32 < 10 (see also Flury et al. 2022a,b).
 |
Fig. 5. Relations between LyC escape fraction fesc(LyC) in low-redshift LyC leaking galaxies derived from SED fits and a) the O32 = [O III]λ5007/[O II]λ3727 emission-line flux ratio, and b) stellar mass M⋆. LyC leakers from Izotov et al. (2016a,b, 2018a,b, 2021a), Borthakur et al. (2014), and Chisholm et al. (2017) are shown by blue-filled circles. The galaxies from Flury et al. (2022a,b) and this paper with detected LyC emission are represented by green- and red-filled circles, respectively. The blue, green, and red arrows denote upper limits in galaxies with non-detected LyC emission. Dotted red lines connect the two different values of the LyC escape fraction from Table 6 for J0232+0025 and J1021+0436, corresponding to higher and lower values obtained from the fluxes within the wavelength ranges with and without the LyC bump, respectively. |
It has also been suggested that fesc(LyC) tends to be higher in low-mass galaxies (Wise et al. 2014; Trebitsch et al. 2017). Previous observations have shown a slight tendency for fesc(LyC) to increase with decreasing stellar mass, albeit with large intrinsic scatter. We present in Fig. 5b the relation between fesc(LyC) and stellar mass M⋆, including our new data. The additional data shows weak dependence of fesc(LyC) on M⋆.
10. Conclusions
We presented new Hubble Space Telescope (HST) Cosmic Origins Spectrograph (COS) observations of eleven low-mass SFGs at redshifts, z, in the range 0.6145–1.0053. These redshifts are approximately a factor of 2 higher than those of the LyC leaking galaxies studied so far with the HST/COS (e.g. Izotov et al. 2016a,b, 2018a,b, 2021a, 2022; Flury et al. 2022a,b), extending detections of LyC emission with COS to z = 1, corresponding to ∼5.9 Gyr after the Big Bang. Consequently, the observed wavelength range for the LyC in galaxies from this paper is considerably larger, starting at rest-frame wavelengths of ∼600–700 Å, compared to ∼800–850 Å in previous studies. This reveals, for the first time, a great diversity in the spectral shapes of the LyC in galaxies with a considerable escape of ionising radiation. In particular, the nebular contribution to LyC emission near the Lyman limit, predicted by earlier studies (Inoue 2010; Simmonds et al. 2024), can now be confirmed and studied for the first time. We supplemented the HST data with the SDSS spectra for all galaxies and the VLT/Xshooter spectrum for J0232+0025 to produce SEDs spanning the entire UV and optical ranges and to derive the intrinsic flux in the LyC. Our main results are summarised as follows:
1. Emission of the LyC is detected in seven out of the eleven galaxies with the escape fraction fesc(LyC) in the range between approximately 2 and 60%. Upper limits of fesc(LyC) were obtained for the remaining galaxies.
2. A complex bump-shaped structure is found in the LyC spectrum in the rest-frame wavelength range 870–912 Å of the spectrum of J0232+0025 and in the rest-frame wavelength range 820–912 Å of the spectrum of J1021+0436. We assume this emission to be nebular, with the monochromatic flux density of the nebular continuum approximately twice that of the stellar LyC emission in J0232+0025, and much higher in J1021+0436. The possible presence of nebular emission may pose a problem in determining the LyC escape fraction in galaxies at z ∼ 0.3–0.4, since only a narrow part of the LyC is generally observed at rest-frame wavelengths ranging from ∼850 to 912 Å. These two varying components (stellar and nebular LyC) can contribute to the scatter in fesc(LyC), which was not measured homogeneously due to observational limitations.
This study demonstrates the importance of studying the spectral shape of the LyC spectrum over a broad wavelength range, in order to unveil the origin of ionising photons escaping from galaxies, and ultimately, refine our understanding of the nature of the sources of reionisation.
Acknowledgments
Based on observations made with the NASA/ESA Hubble Space Telescope, obtained from the data archive at the Space Telescope Science Institute. STScI is operated by the Association of Universities for Research in Astronomy, Inc. under NASA contract NAS 5-26555. Support for this work was provided by NASA through grant numbers HST-GO-16271, HST-GO-17169, and HST-GO-17171 from the Space Telescope Science Institute, which is operated by AURA, Inc., under NASA contract NAS 5-26555. YI, DS, and NG acknowledge support from the joint Ukrainian-Swiss project No. 224866. YI and NG acknowledge support from the Simons Foundation. CS acknowledges support from the Science and Technology Facilities Council (STFC), by the ERC through Advanced Grant 695671 “QUENCH”, by the UKRI Frontier Research grant RISEandFALL. Funding for SDSS-III has been provided by the Alfred P. Sloan Foundation, the Participating Institutions, the National Science Foundation, and the U.S. Department of Energy Office of Science. The SDSS-III web site is http://www.sdss3.org/. SDSS-III is managed by the Astrophysical Research Consortium for the Participating Institutions of the SDSS-III Collaboration. IRAF is distributed by the National Optical Astronomy Observatories, which are operated by the Association of Universities for Research in Astronomy, Inc., under cooperative agreement with the National Science Foundation. STSDAS is a product of the Space Telescope Science Institute, which is operated by AURA for NASA. GALEX is a NASA mission managed by the Jet Propulsion Laboratory. This research has made use of the NASA/IPAC Extragalactic Database (NED) which is operated by the Jet Propulsion Laboratory, California Institute of Technology, under contract with the National Aeronautics and Space Administration.
References
- Ade, P. A. R., Aghanim, N., Armitage-Caplan, C., et al. 2014, A&A, 571, A16 [NASA ADS] [CrossRef] [EDP Sciences] [Google Scholar]
- Ahumada, R., Allende Prieto, C., Almeida, A., et al. 2020, ApJS, 249, 3 [NASA ADS] [CrossRef] [Google Scholar]
- Aller, L. H. 1984, Physics of Thermal Gaseous Nebulae (Dordrecht: Reidel) [Google Scholar]
- Arellano-Córdova, K. Z., Berg, D. A., Mingozzi, M., et al. 2024, ApJ, 968, 98 [Google Scholar]
- Arellano-Córdova, K. Z., Berg, D. A., Mingozzi, M., et al. 2025, MNRAS, 544, 1588 [Google Scholar]
- Begley, R., Cullen, F., McLure, R. J., et al. 2022, MNRAS, 513, 3510 [NASA ADS] [CrossRef] [Google Scholar]
- Berg, D. A., Skillman, E. D., Henry, R. B. C., Erb, D. K., & Carigi, L. 2016, ApJ, 827, 126 [NASA ADS] [CrossRef] [Google Scholar]
- Berg, D. A., Erb, D. K., Henry, R. B. C., Skillman, E. D., & McQuinn, K. B. W. 2019, ApJ, 874, 93 [NASA ADS] [CrossRef] [Google Scholar]
- Bian, F., Fan, X., McGreer, I., Cai, Z., & Jiang, L. 2017, ApJ, 837, 12 [NASA ADS] [CrossRef] [Google Scholar]
- Borthakur, S., Heckman, T. M., Leitherer, C., & Overzier, R. A. 2014, Science, 346, 216 [Google Scholar]
- Bouwens, R. J., Illingworth, G. D., Oesch, P. A., et al. 2015, ApJ, 811, 140 [NASA ADS] [CrossRef] [Google Scholar]
- Brinchmann, J. 2023, MNRAS, 525, 2087 [NASA ADS] [CrossRef] [Google Scholar]
- Cardamone, C., Schawinski, K., Sarzi, M., et al. 2009, MNRAS, 399, 1191 [NASA ADS] [CrossRef] [Google Scholar]
- Cardelli, J. A., Clayton, G. C., & Mathis, J. S. 1989, ApJ, 345, 245 [Google Scholar]
- Chen, Y., Steidel, C. C., Erb, D. K., et al. 2021, MNRAS, 508, 19 [NASA ADS] [CrossRef] [Google Scholar]
- Chisholm, J., Orlitová, I., Schaerer, D., et al. 2017, A&A, 605, A67 [NASA ADS] [CrossRef] [EDP Sciences] [Google Scholar]
- Chisholm, J., Prochaska, J. X., Schaerer, D., Gazagnes, S., & Henry, A. 2020, MNRAS, 498, 2554 [CrossRef] [Google Scholar]
- Chisholm, J., Saldana-Lopez, A., Flury, S., et al. 2022, MNRAS, 517, 5104 [CrossRef] [Google Scholar]
- de Barros, S., Vanzella, E., Amorín, R., et al. 2016, A&A, 585, A51 [NASA ADS] [CrossRef] [EDP Sciences] [Google Scholar]
- Dhiwar, S., Saha, K., Maulick, S., et al. 2024, ApJ, 963, L23 [Google Scholar]
- Draine, B. T. 2003, ARA&A, 41, 241 [NASA ADS] [CrossRef] [Google Scholar]
- Dressler, A., Henry, A., Martin, C. L., et al. 2015, ApJ, 806, 19 [NASA ADS] [CrossRef] [Google Scholar]
- Erb, D. K., Li, Z., Steidel, C. C., et al. 2023, ApJ, 953, 118 [NASA ADS] [CrossRef] [Google Scholar]
- Esteban, C., Méndez-Delgado, J. E., García-Rojas, J., et al. 2025, A&A, 697, 61 [Google Scholar]
- Faisst, A. L. 2016, ApJ, 829, 99 [NASA ADS] [CrossRef] [Google Scholar]
- Feldman, G. J., & Cousins, R. D. 1998, Phys. Rev. D, 57, 3873 [NASA ADS] [CrossRef] [Google Scholar]
- Finkelstein, S. L., D’Aloisio, A., Paardekooper, J.-P., et al. 2019, ApJ, 879, 36 [Google Scholar]
- Flury, S. R., Jaskot, A. E., Ferguson, H. C., et al. 2022a, ApJS, 260, 1 [NASA ADS] [CrossRef] [Google Scholar]
- Flury, S. R., Jaskot, A. E., Ferguson, H. C., et al. 2022b, ApJ, 930, 126 [NASA ADS] [CrossRef] [Google Scholar]
- Flury, S. R., Jaskot, A. E., Saldana-Lopez, A., et al. 2025, ApJ, 985, 128 [Google Scholar]
- Gazagnes, S., Chisholm, J., Schaerer, D., Verhamme, A., & Izotov, Y. 2020, A&A, 639, 85 [Google Scholar]
- Griffiths, A., Conselice, C. J., Ferreira, L., et al. 2022, ApJ, 941, 181 [Google Scholar]
- Guseva, N. G., Izotov, Y. I., Fricke, K. J., & Henkel, C. 2013, A&A, 555, A90 [NASA ADS] [CrossRef] [EDP Sciences] [Google Scholar]
- Harshan, A., Brada, M., Abraham, R., et al. 2024, MNRAS, 532, 1112 [NASA ADS] [CrossRef] [Google Scholar]
- Henry, A., Berg, D. A., Scarlata, C., Verhamme, A., & Erb, D. 2018, ApJ, 855, 96 [Google Scholar]
- Inoue, A. K. 2010, MNRAS, 401, 1325 [NASA ADS] [CrossRef] [Google Scholar]
- Inoue, A. K., Shimizu, I., Iwata, I., & Tanaka, M. 2014, MNRAS, 442, 1805 [NASA ADS] [CrossRef] [Google Scholar]
- Izotov, Y. I., & Thuan, T. X. 1999, ApJ, 511, 639 [NASA ADS] [CrossRef] [Google Scholar]
- Izotov, Y. I., Thuan, T. X., & Lipovetsky, V. A. 1994, ApJ, 435, 647 [NASA ADS] [CrossRef] [Google Scholar]
- Izotov, Y. I., Stasińska, G., Meynet, G., Guseva, N. G., & Thuan, T. X. 2006, A&A, 448, 955 [CrossRef] [EDP Sciences] [Google Scholar]
- Izotov, Y. I., Guseva, N. G., & Thuan, T. X. 2011, ApJ, 728, 161 [NASA ADS] [CrossRef] [Google Scholar]
- Izotov, Y. I., Guseva, N. G., Fricke, K. J., & Henkel, C. 2015, MNRAS, 451, 2251 [NASA ADS] [CrossRef] [Google Scholar]
- Izotov, Y. I., Orlitová, I., Schaerer, D., et al. 2016a, Nature, 529, 178 [Google Scholar]
- Izotov, Y. I., Schaerer, D., Thuan, T. X., et al. 2016b, MNRAS, 461, 3683 [Google Scholar]
- Izotov, Y. I., Schaerer, D., Worseck, G., et al. 2018a, MNRAS, 474, 4514 [Google Scholar]
- Izotov, Y. I., Worseck, G., Schaerer, D., et al. 2018b, MNRAS, 478, 4851 [Google Scholar]
- Izotov, Y. I., Schaerer, D., Worseck, G., et al. 2020, MNRAS, 491, 468 [NASA ADS] [CrossRef] [Google Scholar]
- Izotov, Y. I., Worseck, G., Schaerer, D., et al. 2021a, MNRAS, 503, 1734 [NASA ADS] [CrossRef] [Google Scholar]
- Izotov, Y. I., Guseva, N. G., Fricke, K. J., et al. 2021b, A&A, 646, A138 [NASA ADS] [CrossRef] [EDP Sciences] [Google Scholar]
- Izotov, Y. I., Chisholm, J., Worseck, G., et al. 2022, MNRAS, 515, 2864 [NASA ADS] [CrossRef] [Google Scholar]
- Izotov, Y. I., Schaerer, D., Worseck, G., et al. 2023, MNRAS, 522, 1228 [NASA ADS] [CrossRef] [Google Scholar]
- Jaskot, A. E., & Oey, M. S. 2013, ApJ, 766, 91 [Google Scholar]
- Jaskot, A. E., Silveyra, A. C., Plantinga, A., et al. 2024, ApJ, 972, 92 [NASA ADS] [CrossRef] [Google Scholar]
- Kennicutt, R. C., Jr 1998, ARA&A, 36, 189 [NASA ADS] [CrossRef] [Google Scholar]
- Kerutt, J., Oesch, P. A., Wisotzki, L., et al. 2024, A&A, 684, A42 [NASA ADS] [CrossRef] [EDP Sciences] [Google Scholar]
- Khaire, V., Srianand, R., Choudhury, T. R., & Gaikwad, P. 2016, MNRAS, 457, 4051 [CrossRef] [Google Scholar]
- Kim, K. J., Bayliss, M. B., Rigby, J. R., et al. 2023, ApJ, 955, L17 [NASA ADS] [CrossRef] [Google Scholar]
- Komarova, L., Oey, M. S., Hernandez, S., et al. 2024, ApJ, 967, 117 [Google Scholar]
- Leitherer, C., Hernandez, S., Lee, J. C., & Oey, M. S. 2016, ApJ, 823, L64 [Google Scholar]
- Lewis, J. S. W., Ocvirk, P., Aubert, D., et al. 2020, MNRAS, 496, 4342 [NASA ADS] [CrossRef] [Google Scholar]
- Liu, Y., Jiang, L., Windhorst, R. A., et al. 2023, ApJ, 958, 22 [NASA ADS] [CrossRef] [Google Scholar]
- Madau, P., Giallongo, E., Grazian, A., & Haardt, F. 2024, ApJ, 971, 75 [NASA ADS] [CrossRef] [Google Scholar]
- Makan, K., Worseck, G., Davies, F. B., et al. 2021, ApJ, 912, 38 [NASA ADS] [CrossRef] [Google Scholar]
- Malkan, M. A., & Malkan, B. K. 2021, ApJ, 909, 92 [NASA ADS] [CrossRef] [Google Scholar]
- Marchi, F., Pentericci, L., Guaita, L., et al. 2017, A&A, 601, A73 [NASA ADS] [CrossRef] [EDP Sciences] [Google Scholar]
- Marchi, F., Pentericci, L., Guaita, L., et al. 2018, A&A, 614, A11 [NASA ADS] [CrossRef] [EDP Sciences] [Google Scholar]
- Matthee, J., Mackezie, R., Simcoe, R. A., et al. 2023, ApJ, 950, 67 [NASA ADS] [CrossRef] [Google Scholar]
- Meyer, R. A., Kakiichi, K., Bosman, S. E. I., et al. 2020, MNRAS, 494, 1560 [Google Scholar]
- Mitra, S., Ferrara, A., & Choudhury, T. R. 2013, MNRAS, 428, L1 [Google Scholar]
- Nakajima, K., & Ouchi, M. 2014, MNRAS, 442, 900 [Google Scholar]
- Nakajima, K., Ellis, R. S., Robertson, B. E., Tang, M., & Stark, D. P. 2020, ApJ, 889, 161 [NASA ADS] [CrossRef] [Google Scholar]
- Ouchi, M., Mobasher, B., Shimasaku, K., et al. 2009, ApJ, 706, 1136 [NASA ADS] [CrossRef] [Google Scholar]
- Reddy, N. A., Topping, M. W., Sanders, R. L., Shapley, A. E., & Brammer, G. 2023, ApJ, 952, 167 [CrossRef] [Google Scholar]
- Rhoads, J. E., Wold, I. G. B., Harish, S., et al. 2023, ApJ, 942, L14 [NASA ADS] [CrossRef] [Google Scholar]
- Rivera-Thorsen, T. E., Dahle, H., Chisholm, J., et al. 2019, Science, 366, 738 [Google Scholar]
- Robertson, B. E. 2022, ARA&A, 60, 121 [NASA ADS] [CrossRef] [Google Scholar]
- Robertson, B. E., Furlanetto, S. R., Schneider, E., et al. 2013, ApJ, 768, 71 [Google Scholar]
- Robertson, B. E., Ellis, R. S., Furlanetto, S. R., & Dunlop, J. S. 2015, ApJ, 802, L19 [Google Scholar]
- Runnholm, A., Hayes, M. J., Lin, Y.-H., et al. 2023, MNRAS, 522, 4275 [NASA ADS] [CrossRef] [Google Scholar]
- Saha, K., Tandon, S. N., Simmonds, C., et al. 2020, Nat. Astron., 4, 1185 [NASA ADS] [CrossRef] [Google Scholar]
- Saldana-Lopez, A., Schaerer, D., & Chisholm, J. 2022, A&A, 663, 59 [Google Scholar]
- Saldana-Lopez, A., Hayes, M. J., Le Reste, A., et al. 2025, ApJ, submitted [arXiv:2504.07074] [Google Scholar]
- Saxena, A., Pentericci, L., Ellis, R. S., et al. 2022, MNRAS, 511, 120 [NASA ADS] [CrossRef] [Google Scholar]
- Schaerer, D., Marques-Chaves, R., Barrufet, L., et al. 2022, A&A, 665, L4 [NASA ADS] [CrossRef] [EDP Sciences] [Google Scholar]
- Schaerer, D., Guibert, J., Marques-Chaves, R., & Martins, F. 2025, A&A, 693, 271 [Google Scholar]
- Shapley, A. E., Steidel, C. C., Strom, A. L., et al. 2016, ApJ, 826, L24 [Google Scholar]
- Simmonds, C., Verhamme, A., Inoue, A. K., et al. 2024, MNRAS, 530, 2133 [NASA ADS] [CrossRef] [Google Scholar]
- Steidel, C. C., Bogosavljević, M., Shapley, A. E., et al. 1999, ApJS, 123, 3 [NASA ADS] [CrossRef] [Google Scholar]
- Steidel, C. C., Bogosavljević, M., Shapley, A. E., et al. 2018, ApJ, 869, 123 [Google Scholar]
- Trainor, R. F., Lamb, N. R., Steidel, C. C., et al. 2025, ApJ, submitted [arXiv:2505.15881] [Google Scholar]
- Trebitsch, M., Blaizot, J., Rosdahl, J., Devriendt, J., & Slyz, A. 2017, MNRAS, 470, 224 [Google Scholar]
- Trebitsch, M., Volonteri, M., & Dubois, Y. 2020, MNRAS, 494, 3453 [Google Scholar]
- Vanzella, E., de Barros, S., Castellano, M., et al. 2015, A&A, 576, A116 [NASA ADS] [CrossRef] [EDP Sciences] [Google Scholar]
- Vanzella, E., Nonino, M., Cupani, G., et al. 2018, MNRAS, 476, L15 [Google Scholar]
- Verhamme, A., Orlitová, I., Schaerer, D., & Hayes, M. 2015, A&A, 578, A7 [NASA ADS] [CrossRef] [EDP Sciences] [Google Scholar]
- Vielfaure, J.-B., Vergani, S. D., Japelj, J., et al. 2020, A&A, 641, A30 [NASA ADS] [CrossRef] [EDP Sciences] [Google Scholar]
- Wise, J. H., & Cen, R. 2009, ApJ, 693, 984 [NASA ADS] [CrossRef] [Google Scholar]
- Wise, J. H., Demchenko, V. G., Halicek, M. T., et al. 2014, MNRAS, 442, 2560 [NASA ADS] [CrossRef] [Google Scholar]
- Witstok, J., Smit, R., Maiolino, R., et al. 2021, MNRAS, 508, 1686 [NASA ADS] [CrossRef] [Google Scholar]
- Worseck, G., Prochaska, J. X., O’Meara, J. M., et al. 2014, MNRAS, 445, 1745 [NASA ADS] [CrossRef] [Google Scholar]
- Worseck, G., Prochaska, J. X., Hennawi, J. F., & McQuinn, M. 2016, ApJ, 825, 144 [NASA ADS] [CrossRef] [Google Scholar]
- Wright, E. L. 2006, PASP, 118, 1711 [NASA ADS] [CrossRef] [Google Scholar]
- Xu, X., Henry, A., Heckman, T., et al. 2022, ApJ, 933, 202 [NASA ADS] [CrossRef] [Google Scholar]
- Yajima, H., Choi, J.-H., & Nagamine, K. 2011, MNRAS, 412, 411 [NASA ADS] [CrossRef] [Google Scholar]
- Zackrisson, E., Inoue, A. K., & Jensen, H. 2013, ApJ, 777, 39 [NASA ADS] [CrossRef] [Google Scholar]
- Zackrisson, E., Binggeli, C., Finlator, K., et al. 2017, ApJ, 836, 78 [NASA ADS] [CrossRef] [Google Scholar]
- Zinchenko, I. A., Sobolenko, M., Vílchez, J. M., & Kehrig, C. 2025, A&A, 690, 28 [Google Scholar]
Appendix A: Tables and figures
Apparent AB magnitudes with errors in parentheses, compiled from SDSS and GALEX databases
Extinction-corrected emission-line flux ratios and rest-frame equivalent widths in the Xshooter spectrum of J0232+0025.
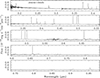 |
Fig. A.1. Rest-frame Xshooter spectrum of J0232+0025. Fluxes are in 10−12 erg s−1 cm−2μm−1, wavelengths are in micrometers. |
 |
Fig. A.2. NUV SB profiles of galaxies (black-filled circles with 1σ error bars). Solid lines are linear fits to the outer regions of the galaxies. |
Extinction-corrected fluxes and restframe equivalent widths of the emission lines in SDSS spectra
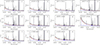 |
Fig. A.3. SED fitting of the galaxy SDSS spectra. The rest-frame spectra, corrected for Milky Way and internal extinction, are shown by grey lines. The total, nebular, and stellar modelled intrinsic SEDs are shown by black, blue, and red lines, respectively. Fluxes and wavelengths are expressed in 10−16 erg s−1 cm−2 Å−1 and angstrom, respectively. |
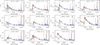 |
Fig. A.4. Comparison of observed COS G140L and SDSS spectra (grey lines) and photometric data (blue-filled circles) with modelled SEDs. For the galaxy J0232+0025, the STIS G230L public spectrum from the program GO 17169 (PI: Schaerer) is added. GALEX FUV and NUV fluxes with 1σ error bars and SDSS fluxes in u, g, r, i, z bands are shown by blue-filled circles. Modelled SEDs, which are reddened by the Milky Way extinction with R(V)MW = 3.1 and the internal extinction with R(V)int = 3.1 and 2.7, are shown by black and red solid lines, respectively. The emission lines in the LyC range of < 912Å correspond to the geocoronal Lyαλ1216Å (brightest line) and the O Iλ1301Å (weaker line). Fluxes are in 10−16 erg s−1 cm−2Å−1, wavelengths are in angstrom. |
All Tables
Coordinates, redshifts, distances, and integrated characteristics of selected galaxies.
Electron temperatures, electron number densities, and element abundances in H II regions derived from SDSS spectra.
Electron temperatures, electron number density, and element abundances obtained from the Xshooter spectrum of J0232+0025.
Apparent AB magnitudes with errors in parentheses, compiled from SDSS and GALEX databases
Extinction-corrected emission-line flux ratios and rest-frame equivalent widths in the Xshooter spectrum of J0232+0025.
Extinction-corrected fluxes and restframe equivalent widths of the emission lines in SDSS spectra
All Figures
|
Fig. 1. HST COS/NUV acquisition images of the candidate LyC leaking galaxies on a surface brightness scale. The COS spectroscopic aperture with a diameter of 2 |
| In the text | |
|
Fig. 2. (a) Extinction-corrected rest-frame Xshooter spectrum of J0232+0025 (grey line) overlaid with modelled SEDs. Nebular, stellar, and total (nebular+stellar) SEDs are represented by blue, red, and black lines, respectively. (b) Observed rest-frame SDSS (black line) and Xshooter (grey line) spectra of J0232+0025 overlaid with their corresponding attenuated modelled SEDs (the SDSS spectrum shown in red and the Xshooter spectrum shown in blue). (c) Observed rest-frame COS, STIS, and Xshooter spectra of J0232+0025 (grey lines) overlaid with modelled SEDs attenuated by adopting either R(V) = 3.1 (black line) and R(V) = 2.7 (red line), assuming the Cardelli et al. (1989) reddening law. Blue-filled circles denote GALEX FUV and NUV, and SDSS u, g, r, i, z photometric data. The red cross indicates the NUV flux calculated from the SED by adding the Lyα emission with an EW(Lyα) = 108 Å from the STIS spectrum. Dotted black lines indicate GALEX FUV and NUV response curves reduced to the J0232+0025 rest-frame. (d) Observed COS spectrum of J0232+0025 (grey line) overlaid with the intrinsic modelled SED (dash-dotted blue line) and the SED attenuated with R(V) = 2.7. The short horizontal red line represents the level of the LyC stellar continuum, and the vertical dotted line indicates the location of the LyC limit at 912 Å. |
| In the text | |
|
Fig. 3. Isophotes of the J0232+0025 COS/NUV acquisition image in arbitrary units but with equal steps. The diameter of the outer isophote is larger than the slit width of 0 |
| In the text | |
|
Fig. 4. Fragments of smoothed spectra in the LyC region for 11 galaxies at z ∼ 0.6–1.0 (a) – (k) (this paper), and for J1243+4646 (l) from Izotov et al. (2018b). Modelled intrinsic SEDs, attenuated by Milky Way extinction with R(V)MW = 3.1 and internal extinction with R(V)int = 2.7, assuming the Cardelli et al. (1989) reddening law, and the unreddened SEDs are shown by solid red and dash-dotted blue lines, respectively. Emission features at the observed wavelengths λ1216Å and λ1301Å are geocoronal Lyα and O I emission lines, respectively. The parts of the observed spectra containing the LyC bumps for a) J0232+0025, h) J1021+0436, and l) J1243+4646 are highlighted by magenta lines. Dotted black lines in all panels indicate the GALEX FUV response curve reduced to the galaxy rest-frame. The vertical dotted line in all panels indicates the location of the LyC limit at 912 Å. Fluxes are in 10−16 erg s−1 cm−2 Å−1, and wavelengths are in angstrom. |
| In the text | |
|
Fig. 5. Relations between LyC escape fraction fesc(LyC) in low-redshift LyC leaking galaxies derived from SED fits and a) the O32 = [O III]λ5007/[O II]λ3727 emission-line flux ratio, and b) stellar mass M⋆. LyC leakers from Izotov et al. (2016a,b, 2018a,b, 2021a), Borthakur et al. (2014), and Chisholm et al. (2017) are shown by blue-filled circles. The galaxies from Flury et al. (2022a,b) and this paper with detected LyC emission are represented by green- and red-filled circles, respectively. The blue, green, and red arrows denote upper limits in galaxies with non-detected LyC emission. Dotted red lines connect the two different values of the LyC escape fraction from Table 6 for J0232+0025 and J1021+0436, corresponding to higher and lower values obtained from the fluxes within the wavelength ranges with and without the LyC bump, respectively. |
| In the text | |
|
Fig. A.1. Rest-frame Xshooter spectrum of J0232+0025. Fluxes are in 10−12 erg s−1 cm−2μm−1, wavelengths are in micrometers. |
| In the text | |
|
Fig. A.2. NUV SB profiles of galaxies (black-filled circles with 1σ error bars). Solid lines are linear fits to the outer regions of the galaxies. |
| In the text | |
|
Fig. A.3. SED fitting of the galaxy SDSS spectra. The rest-frame spectra, corrected for Milky Way and internal extinction, are shown by grey lines. The total, nebular, and stellar modelled intrinsic SEDs are shown by black, blue, and red lines, respectively. Fluxes and wavelengths are expressed in 10−16 erg s−1 cm−2 Å−1 and angstrom, respectively. |
| In the text | |
|
Fig. A.4. Comparison of observed COS G140L and SDSS spectra (grey lines) and photometric data (blue-filled circles) with modelled SEDs. For the galaxy J0232+0025, the STIS G230L public spectrum from the program GO 17169 (PI: Schaerer) is added. GALEX FUV and NUV fluxes with 1σ error bars and SDSS fluxes in u, g, r, i, z bands are shown by blue-filled circles. Modelled SEDs, which are reddened by the Milky Way extinction with R(V)MW = 3.1 and the internal extinction with R(V)int = 3.1 and 2.7, are shown by black and red solid lines, respectively. The emission lines in the LyC range of < 912Å correspond to the geocoronal Lyαλ1216Å (brightest line) and the O Iλ1301Å (weaker line). Fluxes are in 10−16 erg s−1 cm−2Å−1, wavelengths are in angstrom. |
| In the text | |
Current usage metrics show cumulative count of Article Views (full-text article views including HTML views, PDF and ePub downloads, according to the available data) and Abstracts Views on Vision4Press platform.
Data correspond to usage on the plateform after 2015. The current usage metrics is available 48-96 hours after online publication and is updated daily on week days.
Initial download of the metrics may take a while.