Fig. 4.
Download original image
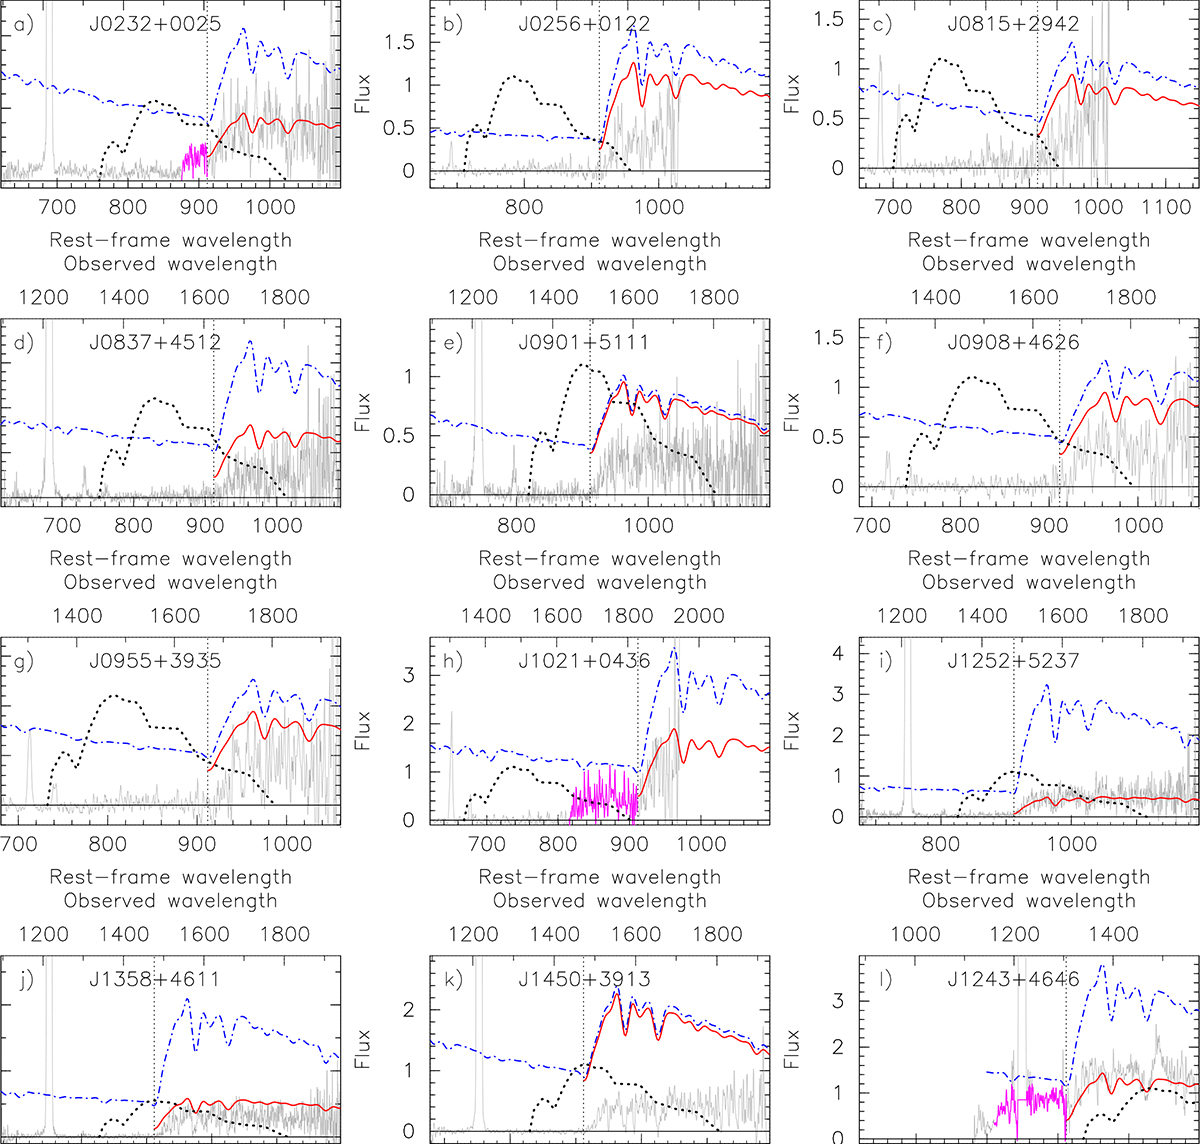
Fragments of smoothed spectra in the LyC region for 11 galaxies at z ∼ 0.6–1.0 (a) – (k) (this paper), and for J1243+4646 (l) from Izotov et al. (2018b). Modelled intrinsic SEDs, attenuated by Milky Way extinction with R(V)MW = 3.1 and internal extinction with R(V)int = 2.7, assuming the Cardelli et al. (1989) reddening law, and the unreddened SEDs are shown by solid red and dash-dotted blue lines, respectively. Emission features at the observed wavelengths λ1216Å and λ1301Å are geocoronal Lyα and O I emission lines, respectively. The parts of the observed spectra containing the LyC bumps for a) J0232+0025, h) J1021+0436, and l) J1243+4646 are highlighted by magenta lines. Dotted black lines in all panels indicate the GALEX FUV response curve reduced to the galaxy rest-frame. The vertical dotted line in all panels indicates the location of the LyC limit at 912 Å. Fluxes are in 10−16 erg s−1 cm−2 Å−1, and wavelengths are in angstrom.
Current usage metrics show cumulative count of Article Views (full-text article views including HTML views, PDF and ePub downloads, according to the available data) and Abstracts Views on Vision4Press platform.
Data correspond to usage on the plateform after 2015. The current usage metrics is available 48-96 hours after online publication and is updated daily on week days.
Initial download of the metrics may take a while.