Fig. A.4.
Download original image
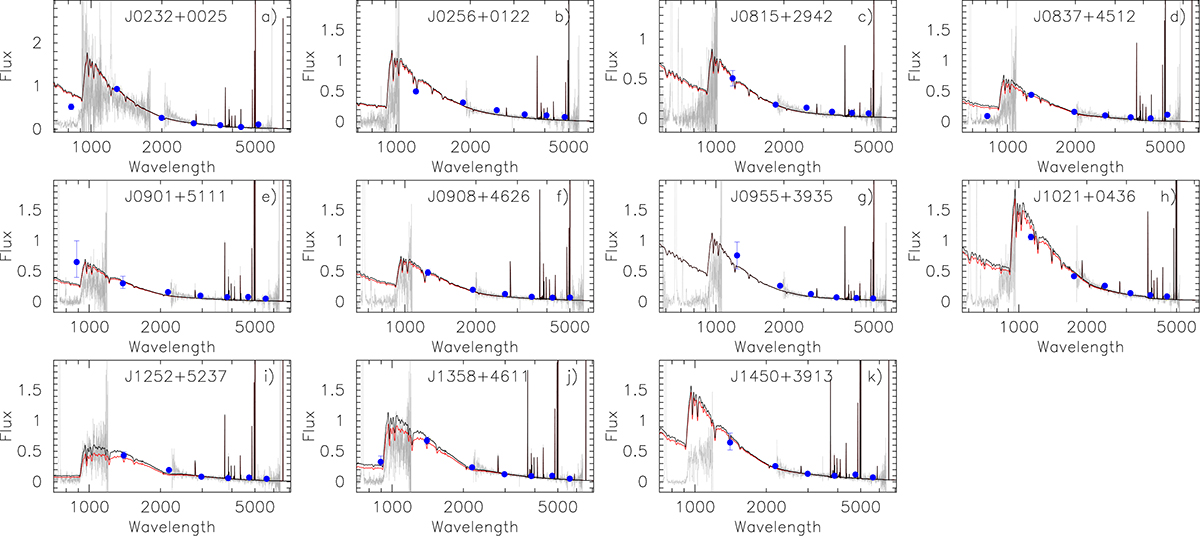
Comparison of observed COS G140L and SDSS spectra (grey lines) and photometric data (blue-filled circles) with modelled SEDs. For the galaxy J0232+0025, the STIS G230L public spectrum from the program GO 17169 (PI: Schaerer) is added. GALEX FUV and NUV fluxes with 1σ error bars and SDSS fluxes in u, g, r, i, z bands are shown by blue-filled circles. Modelled SEDs, which are reddened by the Milky Way extinction with R(V)MW = 3.1 and the internal extinction with R(V)int = 3.1 and 2.7, are shown by black and red solid lines, respectively. The emission lines in the LyC range of < 912Å correspond to the geocoronal Lyαλ1216Å (brightest line) and the O Iλ1301Å (weaker line). Fluxes are in 10−16 erg s−1 cm−2Å−1, wavelengths are in angstrom.
Current usage metrics show cumulative count of Article Views (full-text article views including HTML views, PDF and ePub downloads, according to the available data) and Abstracts Views on Vision4Press platform.
Data correspond to usage on the plateform after 2015. The current usage metrics is available 48-96 hours after online publication and is updated daily on week days.
Initial download of the metrics may take a while.