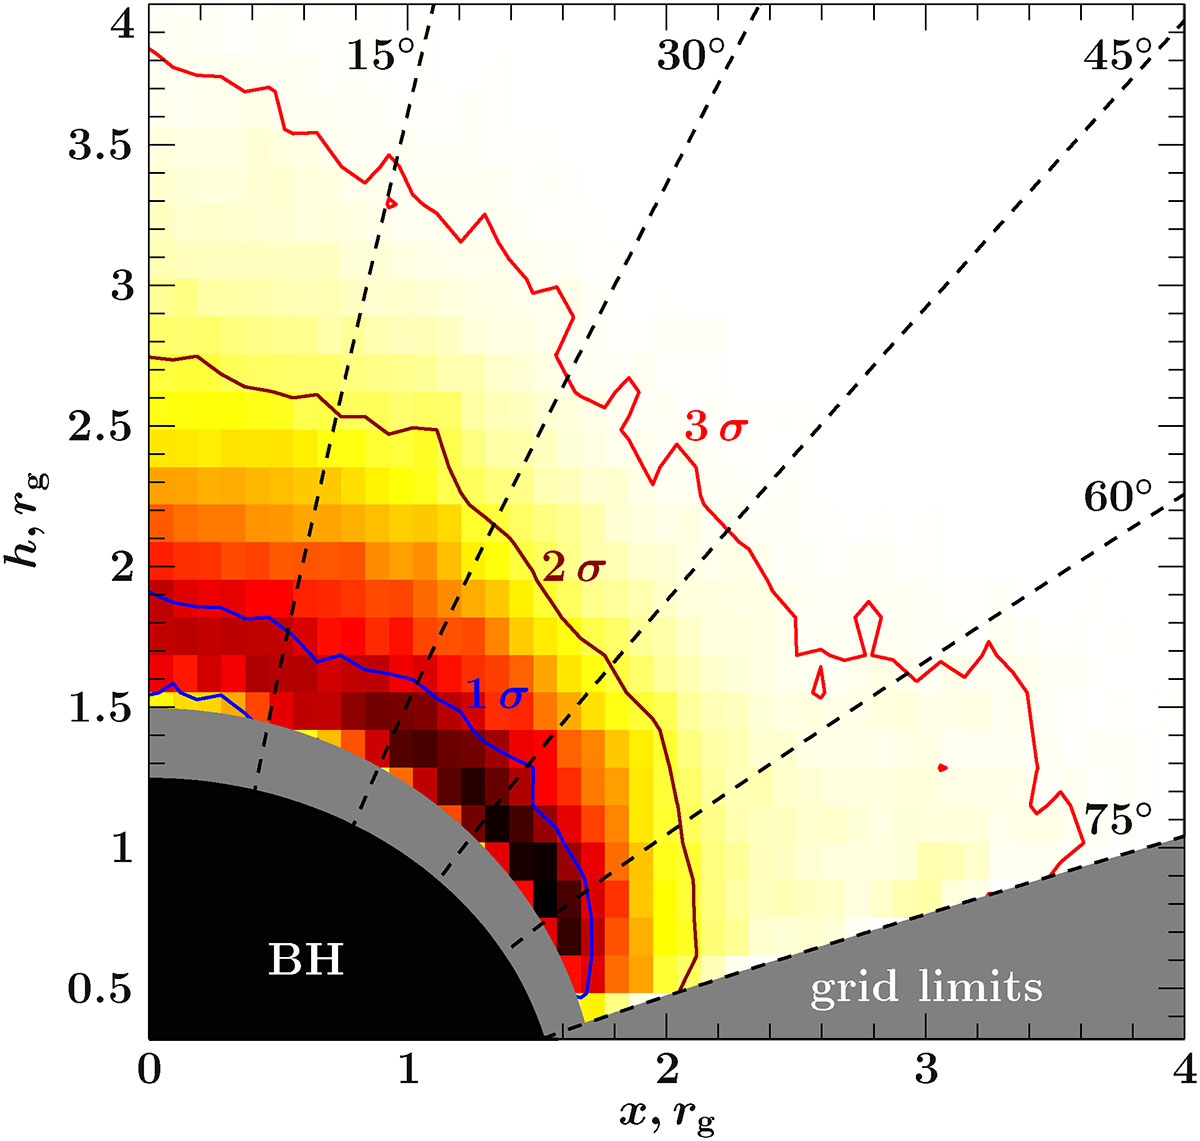
Fig. 10.
Download original image
Ring size and height probability distribution with 1σ, 2σ, and 3σ confidence levels, based on the MCMC results (Fig. 9, for Model 2a) extended to lower heights. The color scale shows the probability distribution. The dashed lines show combinations of h and x corresponding to constant polar angles, θ. The black region is limited by the BH event horizon, the gray region denotes RELXILL parameter grid limits.
Current usage metrics show cumulative count of Article Views (full-text article views including HTML views, PDF and ePub downloads, according to the available data) and Abstracts Views on Vision4Press platform.
Data correspond to usage on the plateform after 2015. The current usage metrics is available 48-96 hours after online publication and is updated daily on week days.
Initial download of the metrics may take a while.