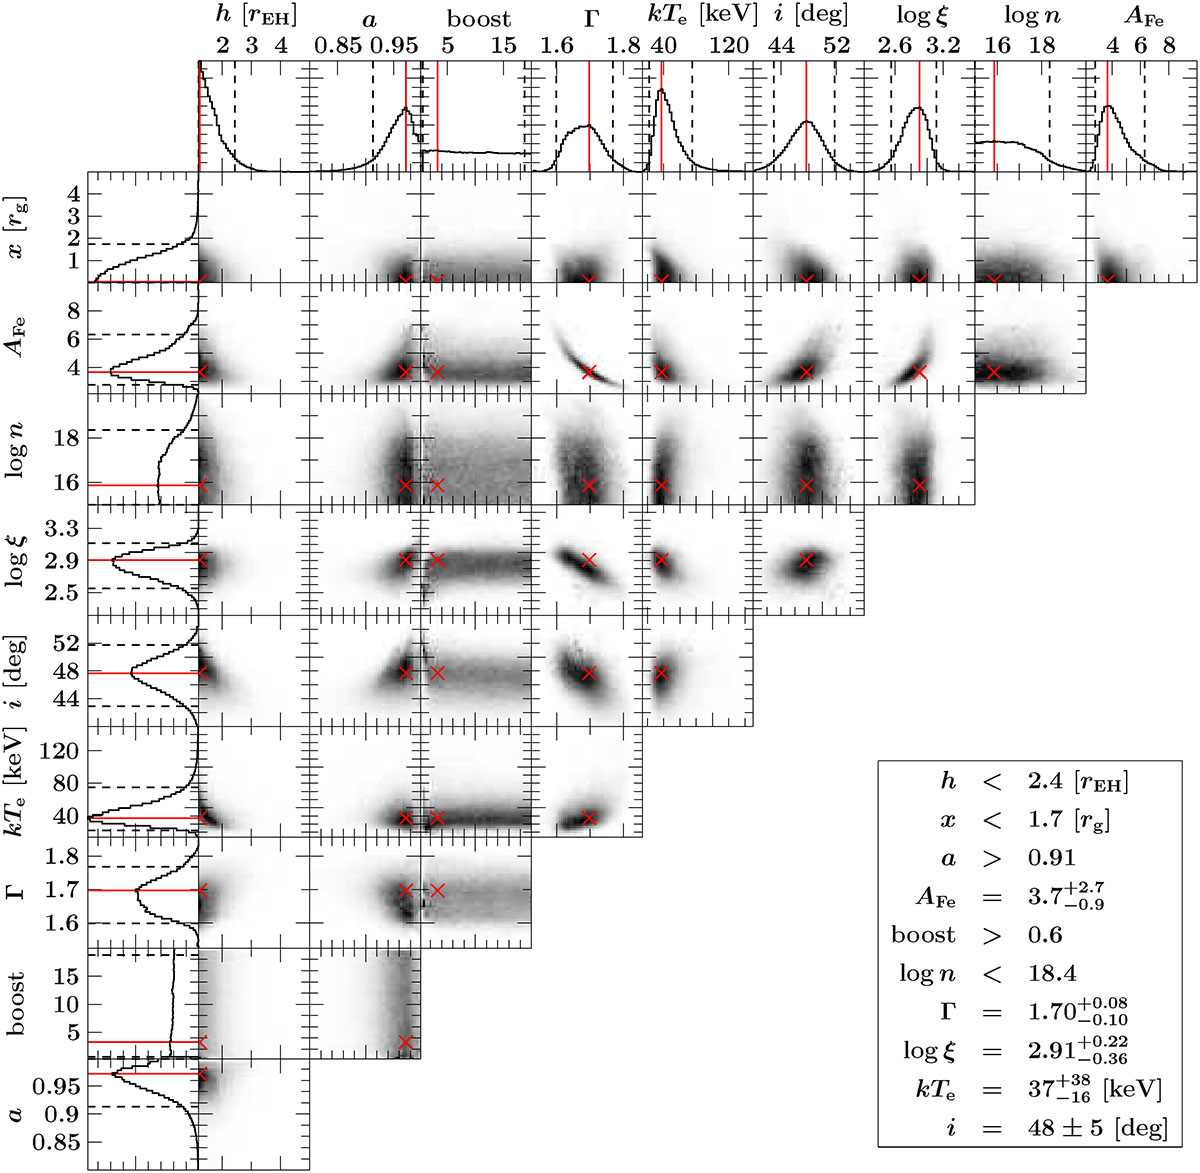
Fig. 9.
Download original image
MCMC simulation results for the relevant parameters of Model 2a. Each 1D histogram shows probability distribution of a single parameter values. Each 2D histogram shows probability distribution of each pair of parameters. The red crosses mark the most probable parameter positions according to 1D probability distributions. Additionally, the inset in the lower right corner shows the most probable values with 90% confidence intervals.
Current usage metrics show cumulative count of Article Views (full-text article views including HTML views, PDF and ePub downloads, according to the available data) and Abstracts Views on Vision4Press platform.
Data correspond to usage on the plateform after 2015. The current usage metrics is available 48-96 hours after online publication and is updated daily on week days.
Initial download of the metrics may take a while.