Fig. 2.
Download original image
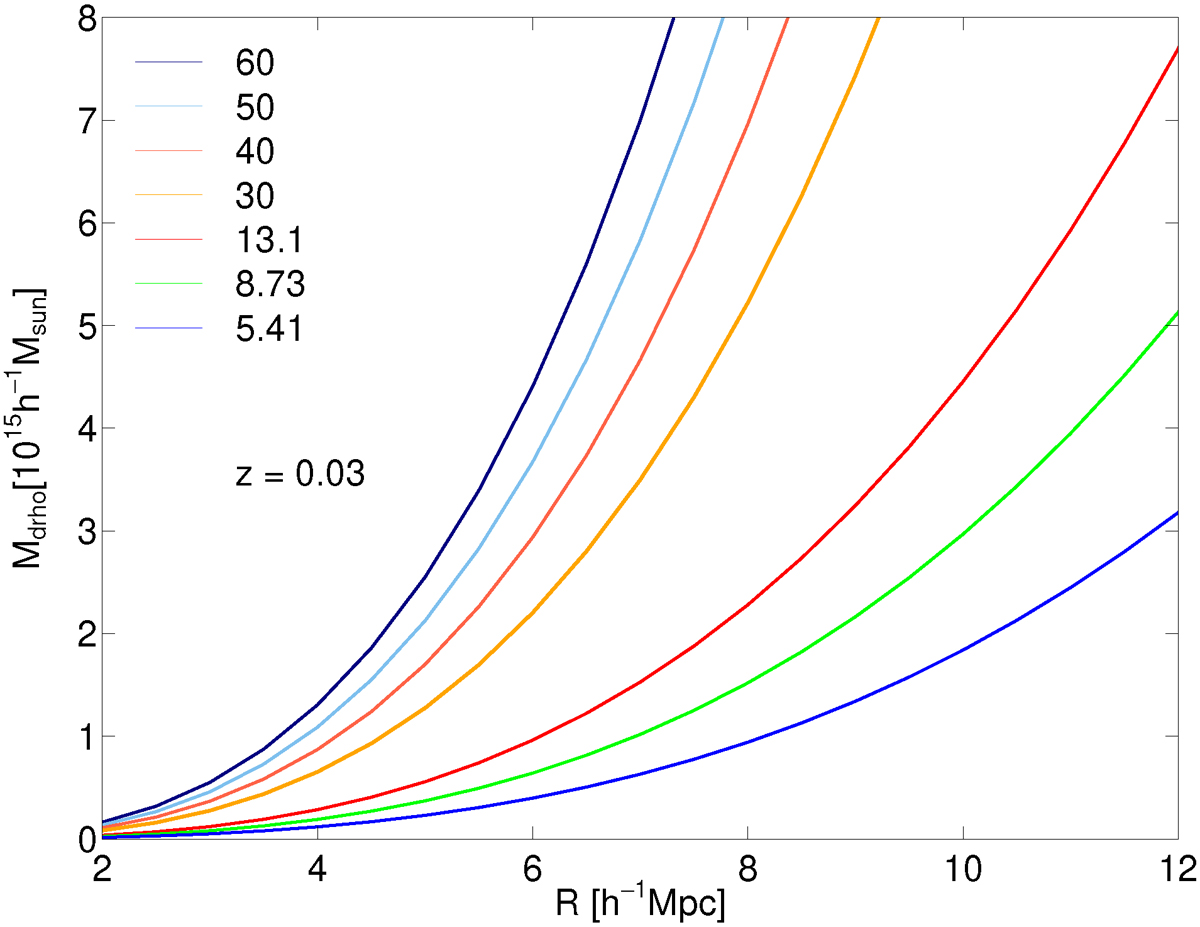
Mass–radius relation from the spherical collapse model. Different lines correspond to the masses for different density contrasts, Δρ (Eq. (1)). Lines M60 − M30 correspond to the density contrasts, Δρinf, at the borders of the spheres of influence as found for clusters. Lines M13.1, M8.73, and M5.41 corresponds to the turnaround, future collapse, and zero gravity density contrasts. All lines are calculated for the redshift z = 0.03.
Current usage metrics show cumulative count of Article Views (full-text article views including HTML views, PDF and ePub downloads, according to the available data) and Abstracts Views on Vision4Press platform.
Data correspond to usage on the plateform after 2015. The current usage metrics is available 48-96 hours after online publication and is updated daily on week days.
Initial download of the metrics may take a while.