Fig. 3.
Download original image
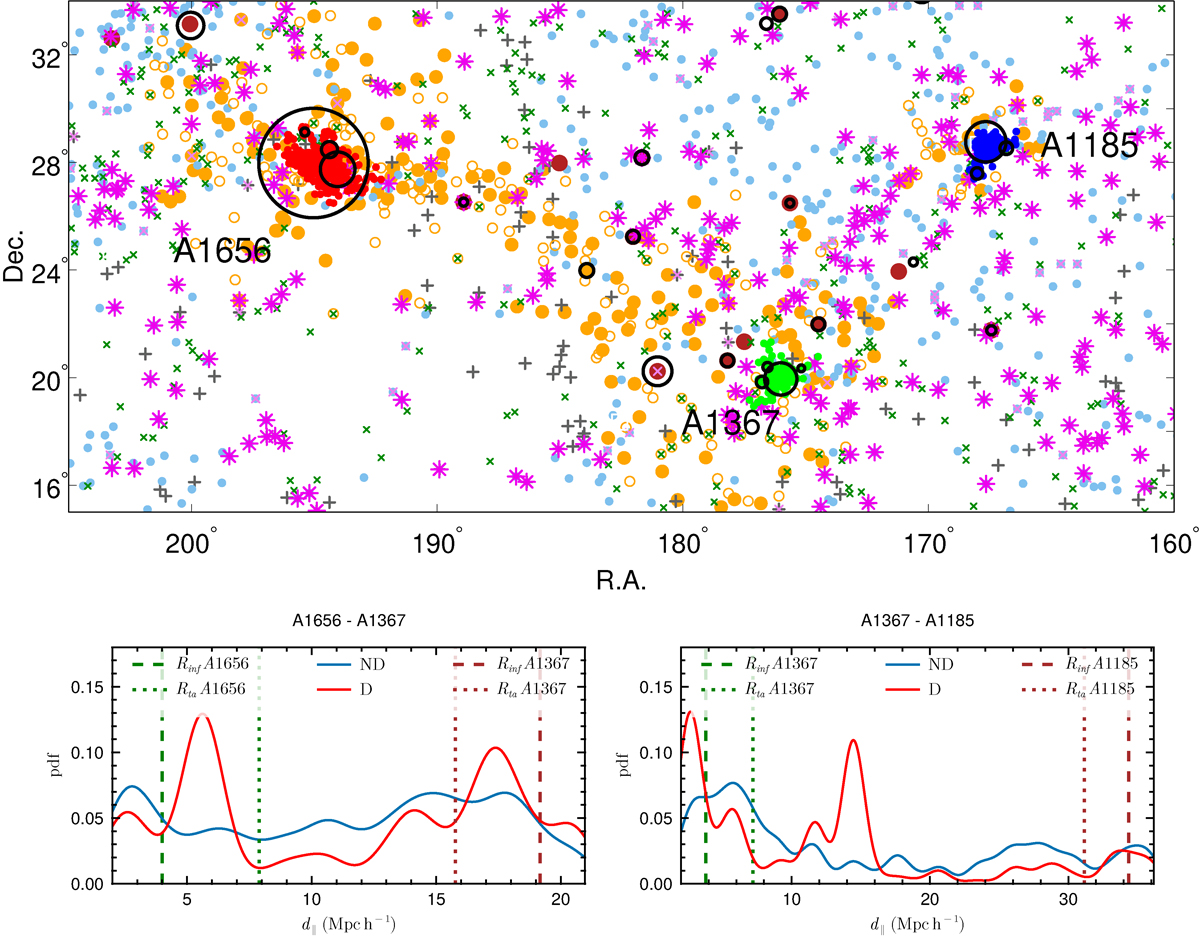
Upper panel: Sky distribution of groups (filled circles and crosses) and single galaxies (empty circles) in the region of the Coma and the Leo superclusters. Colours of symbols show groups in different global luminosity-density regions (orange D8 ≥ 5, blue 5 > D8 ≥ 1.5, and grey crosses D8 < 1.5). To avoid strong projections, we only plot single galaxies in superclusters (D8 ≥ 5). Filament member galaxies in groups are shown with magenta x-s and single galaxies with green x-s. Violet stars show members of long filaments with length ![]() Mpc. In groups we show the location of the brightest group galaxies only. Dark red circles: Lgr ≥ 15 × 1010 h−2 L⊙. Member galaxies of clusters A1656, A1367, and A1185 are shown in red, green, and blue. Black circles mark the location of groups from WH24 catalogue, circle sizes are proportional to group richness. Lower panels: Number density distribution of galaxies in groups and single galaxies between clusters A1656 and A1367 (left panel), and A1367 and A1185 (right panel). Here, d∥ denotes the coordinate on a straight line between the clusters, and red and blue lines show the linear density and linear number density distributions, respectively. The cross-section radius, where the densities were evaluated, was 8 h−1 Mpc. The vertical dashed and dotted lines show influence and turnaround radii locations away from their respective end-point clusters.
Mpc. In groups we show the location of the brightest group galaxies only. Dark red circles: Lgr ≥ 15 × 1010 h−2 L⊙. Member galaxies of clusters A1656, A1367, and A1185 are shown in red, green, and blue. Black circles mark the location of groups from WH24 catalogue, circle sizes are proportional to group richness. Lower panels: Number density distribution of galaxies in groups and single galaxies between clusters A1656 and A1367 (left panel), and A1367 and A1185 (right panel). Here, d∥ denotes the coordinate on a straight line between the clusters, and red and blue lines show the linear density and linear number density distributions, respectively. The cross-section radius, where the densities were evaluated, was 8 h−1 Mpc. The vertical dashed and dotted lines show influence and turnaround radii locations away from their respective end-point clusters.
Current usage metrics show cumulative count of Article Views (full-text article views including HTML views, PDF and ePub downloads, according to the available data) and Abstracts Views on Vision4Press platform.
Data correspond to usage on the plateform after 2015. The current usage metrics is available 48-96 hours after online publication and is updated daily on week days.
Initial download of the metrics may take a while.