Fig. 6.
Download original image
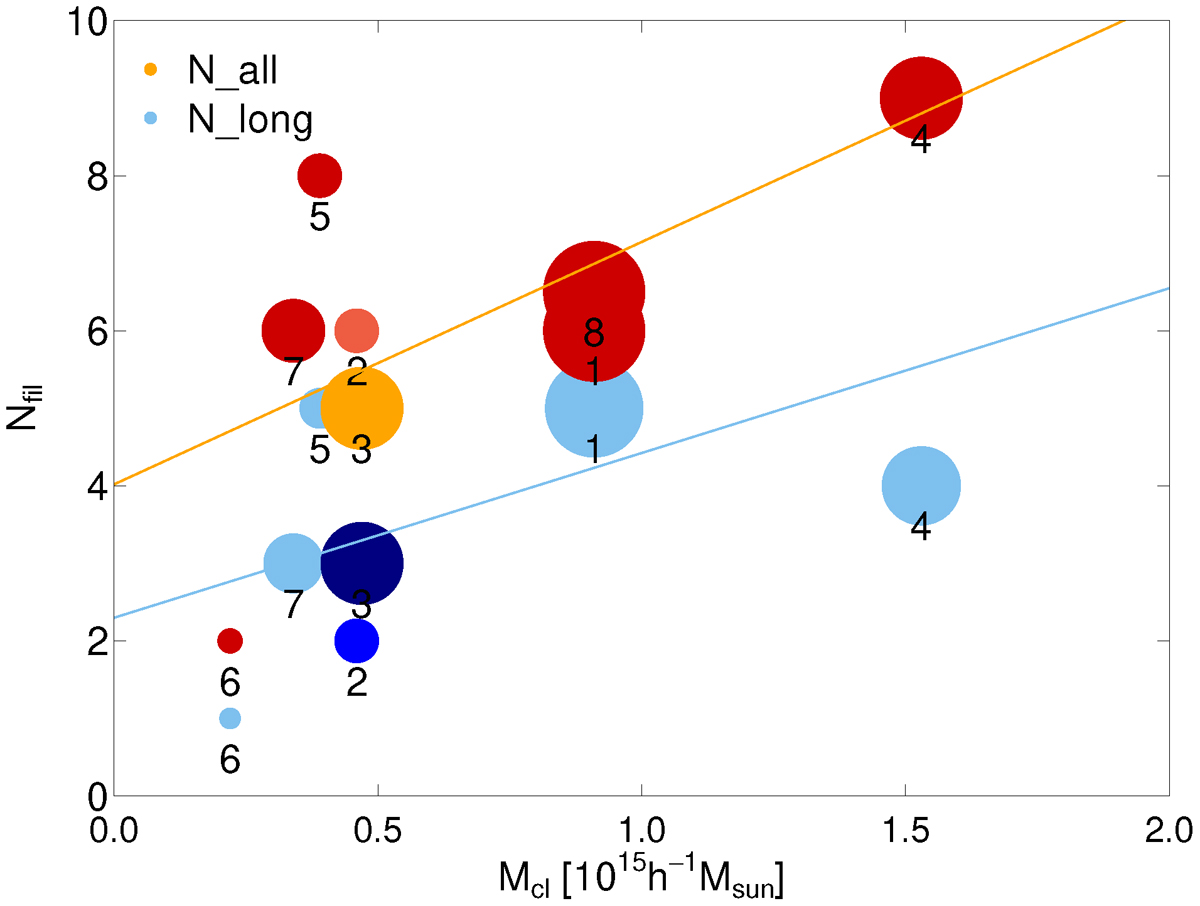
Number of filaments connected to a cluster, Nfil, versus the cluster mass, Mcl. Symbol sizes are proportional to the number of components in a cluster, Ncomp. The numbers are order numbers of a cluster from Table 2. Red symbols show the number of all filaments, and blue symbols the number of long filaments with ![]() Mpc. Light red and orange symbols and dark blue symbols correspond to clusters with higher values of star-forming galaxies, A1367 and A1185 (clusters 2 and 3).
Mpc. Light red and orange symbols and dark blue symbols correspond to clusters with higher values of star-forming galaxies, A1367 and A1185 (clusters 2 and 3).
Current usage metrics show cumulative count of Article Views (full-text article views including HTML views, PDF and ePub downloads, according to the available data) and Abstracts Views on Vision4Press platform.
Data correspond to usage on the plateform after 2015. The current usage metrics is available 48-96 hours after online publication and is updated daily on week days.
Initial download of the metrics may take a while.