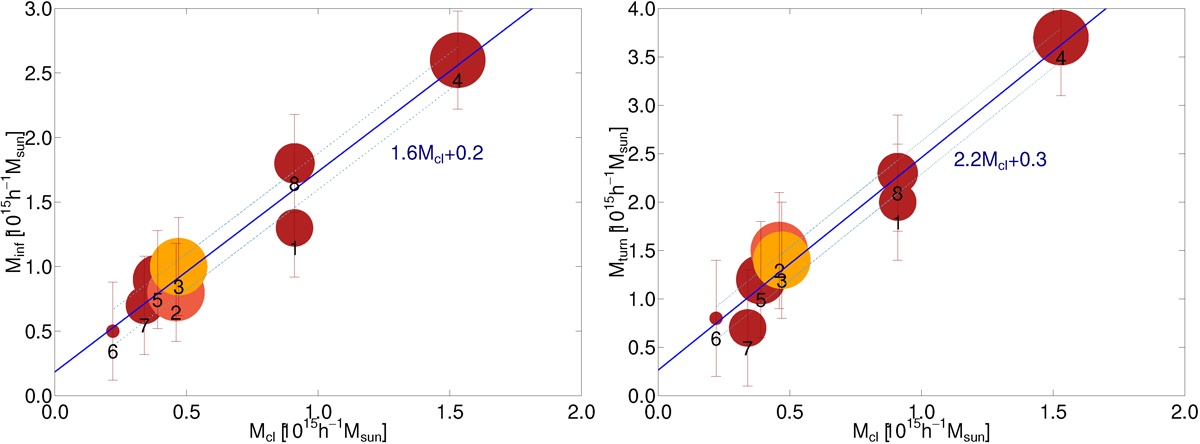
Fig. 7.
Download original image
Scaling relations between the cluster mass, Mcl, and the mass embedded in the sphere of influence (Minf, left panel) and turnaround mass (Mta, right panel). Symbol sizes are proportional to the number of all filaments connected to a cluster, Nfil. Dark red symbols show clusters with a high percentage of quiescent galaxies, and light red and orange symbols show clusters with a lower percentage of quiescent galaxies (light red – A1367, and orange – A1185). Dashed lines show 1σ errors of the linear fit, and error bars show mass errors (Table 2). Numbers are order numbers of a cluster from Table 2.
Current usage metrics show cumulative count of Article Views (full-text article views including HTML views, PDF and ePub downloads, according to the available data) and Abstracts Views on Vision4Press platform.
Data correspond to usage on the plateform after 2015. The current usage metrics is available 48-96 hours after online publication and is updated daily on week days.
Initial download of the metrics may take a while.