Fig. 2
Download original image
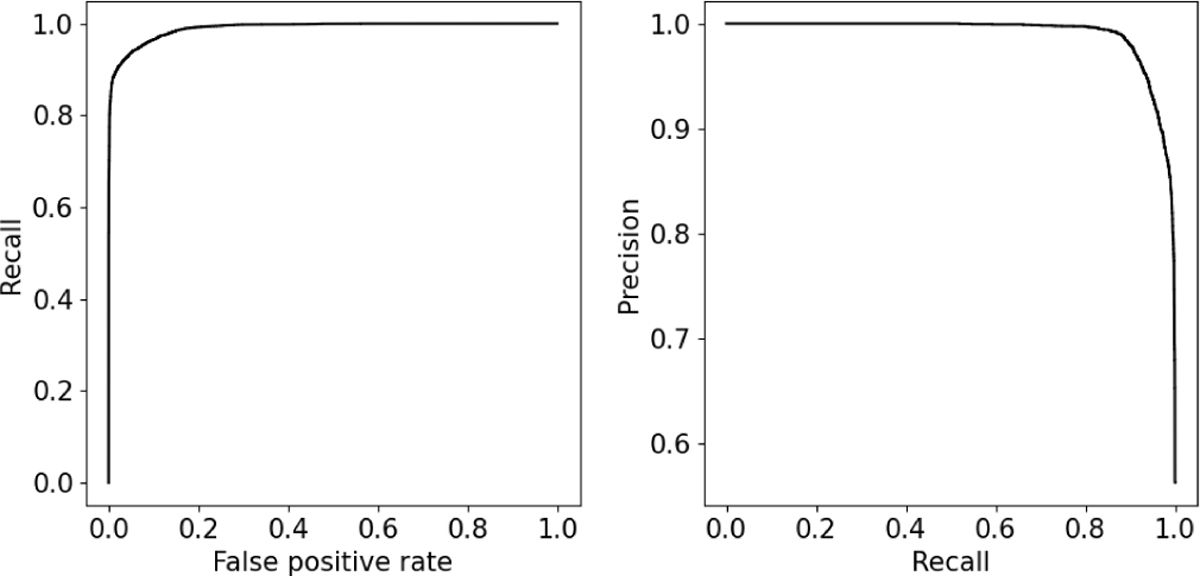
Receiver-operator characteristic curve (left panel) and the precision vs. recall curve (right panel). The ROC curve shows the recall (true-positive rate) of the model against the ability to recognize false positives (false-positive rate) for different classification thresholds. Our model is highly successful at identifying false positives, as shown by the high AUC value (see Table A.1). The plot of the fraction of exocomets that the model classified as exocomets (recall) vs. the fraction of correctly classified planets (precision) shows the trade-off between having no false positives (high precision) and identifying all exocomet transits (high recall).
Current usage metrics show cumulative count of Article Views (full-text article views including HTML views, PDF and ePub downloads, according to the available data) and Abstracts Views on Vision4Press platform.
Data correspond to usage on the plateform after 2015. The current usage metrics is available 48-96 hours after online publication and is updated daily on week days.
Initial download of the metrics may take a while.