Fig. 3
Download original image
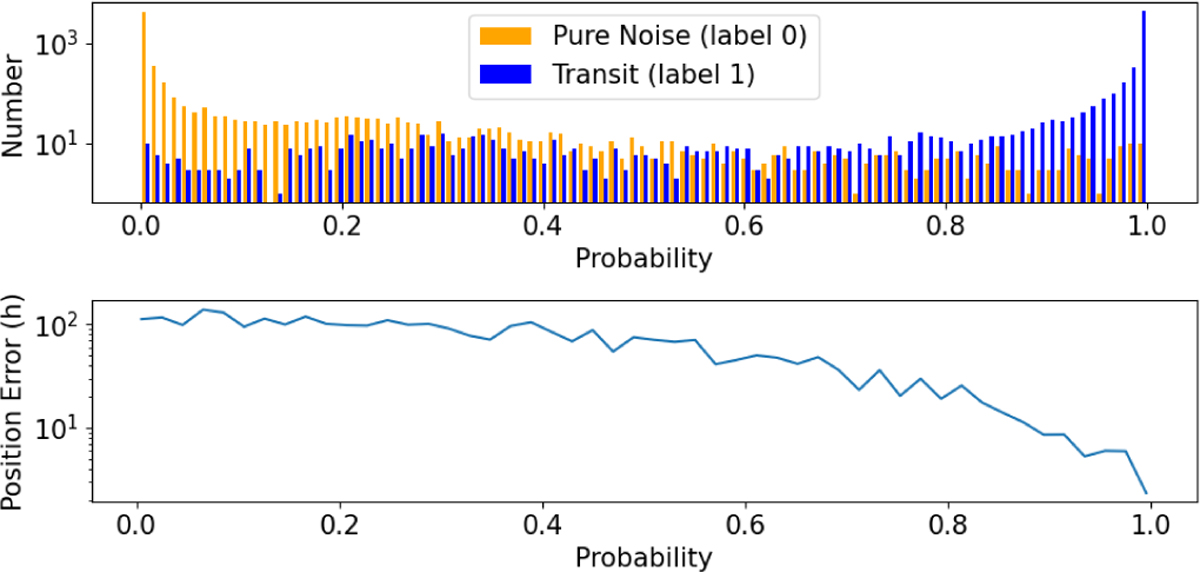
Histogram of the results on the test set and error on the transit position found by the network. Top panel: histogram of the result of the neural network applied to the test data. Most of the 1-labeled light curves with an exocomet transit yield a probability close to 1, while there are only a few false positives (0-labeled light curves yielding a high probability). Above the chosen threshold, there is more than two order of magnitude between the number of true positives and false positive. Bottom panel: mean error of the position of the transit as a function of the probability of the presence of a transit assigned by the network to the light curves. This error is a few hours at most for the transits identified by the algorithm.
Current usage metrics show cumulative count of Article Views (full-text article views including HTML views, PDF and ePub downloads, according to the available data) and Abstracts Views on Vision4Press platform.
Data correspond to usage on the plateform after 2015. The current usage metrics is available 48-96 hours after online publication and is updated daily on week days.
Initial download of the metrics may take a while.