Open Access
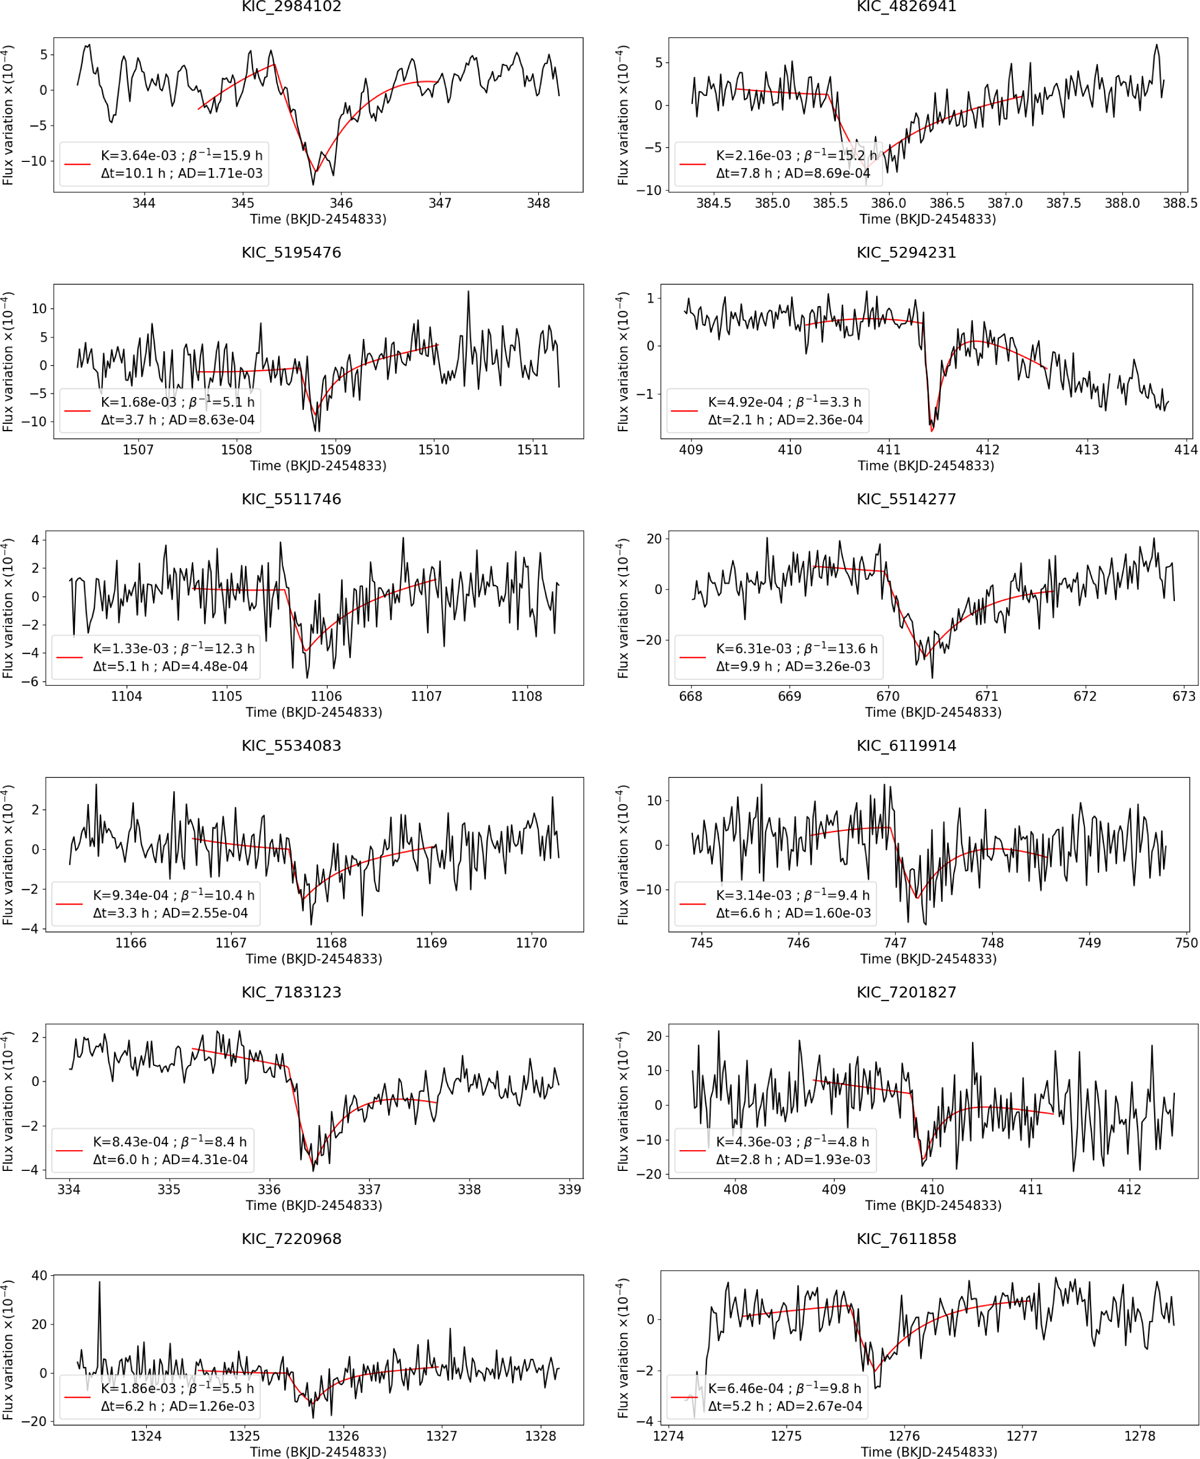
Fig. C.1
Download original image
Plots of the light curves of the possibly detected cometary transits in the second tier catalog. The plots cover 5 days and are centered on the transit time and with an exocomet transit fit superimposed (red line).
This figure is made of several images, please see below:
Current usage metrics show cumulative count of Article Views (full-text article views including HTML views, PDF and ePub downloads, according to the available data) and Abstracts Views on Vision4Press platform.
Data correspond to usage on the plateform after 2015. The current usage metrics is available 48-96 hours after online publication and is updated daily on week days.
Initial download of the metrics may take a while.