Open Access
Fig. 10.
Download original image
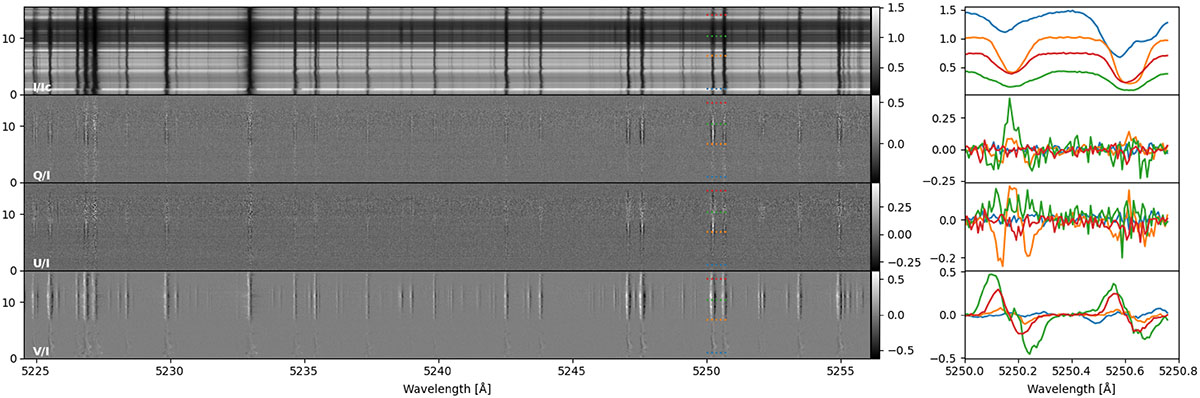
Restored Stokes spectrum and line profiles from a FISS-SP observation of a pore in an active region. Y-axis of the left panel is in slit direction and corresponding tick-marks are in arc seconds. The right panel shows line profiles of the 5250 Å Fe I lines at positions marked in the left panel.
Current usage metrics show cumulative count of Article Views (full-text article views including HTML views, PDF and ePub downloads, according to the available data) and Abstracts Views on Vision4Press platform.
Data correspond to usage on the plateform after 2015. The current usage metrics is available 48-96 hours after online publication and is updated daily on week days.
Initial download of the metrics may take a while.