Fig. 3.
Download original image
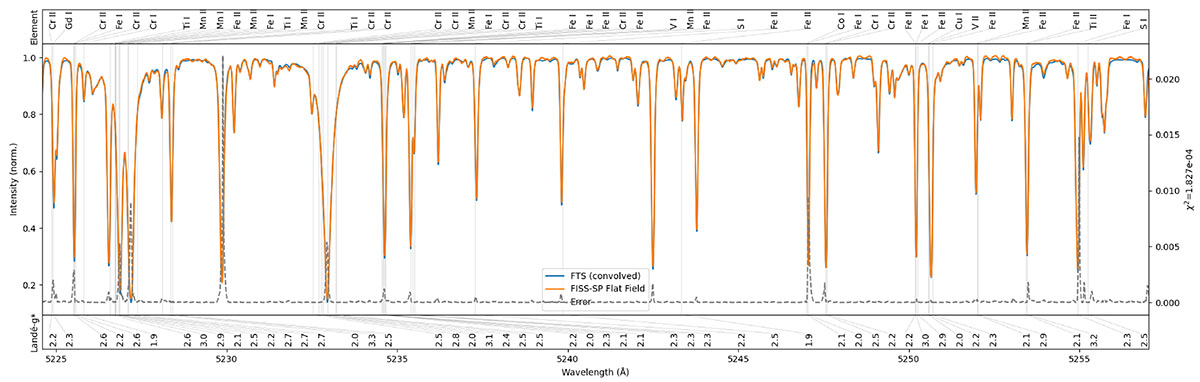
Comparison of a single spectrum from a temporally averaged and dark- and flatfield-corrected FISS-SP flatfield measurement with the FTS after convolution with the FISS-SP SPSF. The error curve is the square difference between the convoluted FTS and the measured profile. Vertical lines in the plot indicate magnetically very sensitive absorption lines with an effective Landé-factor (g∗) (Shenstone & Blair 1929) greater than 1.9.
Current usage metrics show cumulative count of Article Views (full-text article views including HTML views, PDF and ePub downloads, according to the available data) and Abstracts Views on Vision4Press platform.
Data correspond to usage on the plateform after 2015. The current usage metrics is available 48-96 hours after online publication and is updated daily on week days.
Initial download of the metrics may take a while.