Fig. C.3.
Download original image
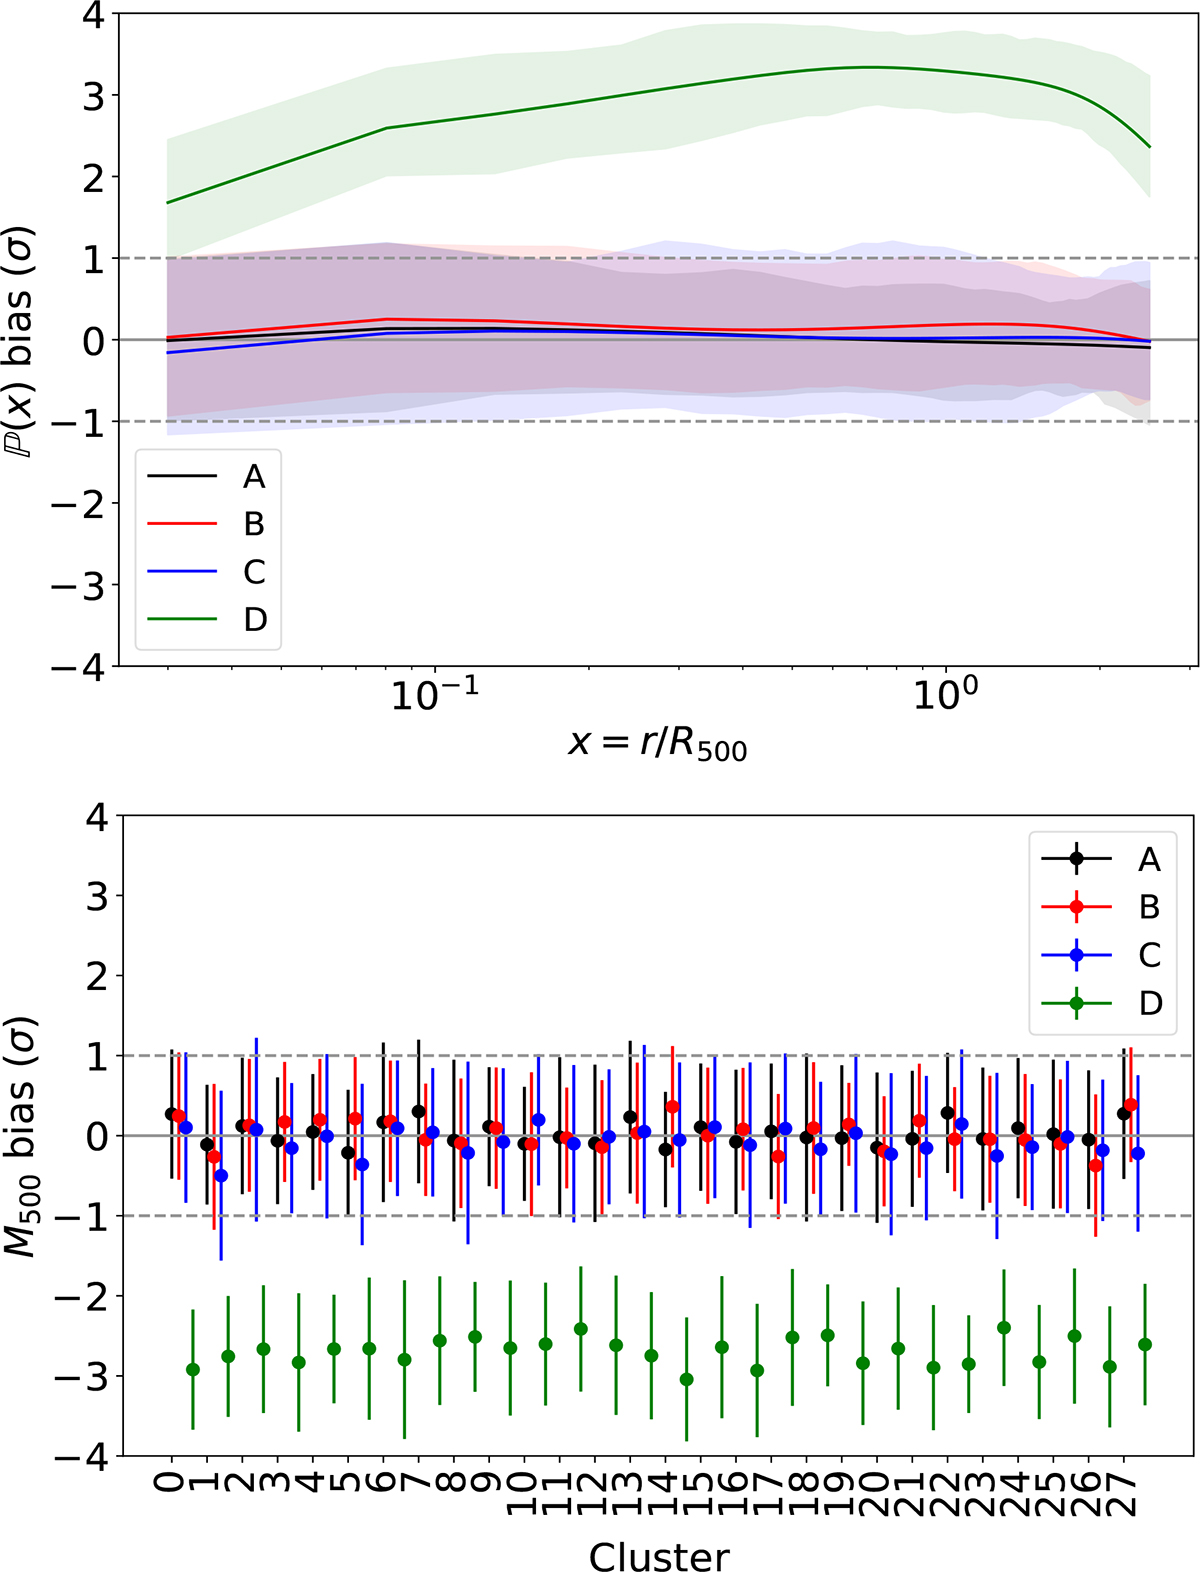
Top: Bias of the UPP fitted to mock profiles with an intrinsic scatter of σint = 0.4. The colours indicate the results with different priors for M500, i and δ, from case A to D, as detailed in the text. The solid lines show the mean bias for the 60 realisations, and the shaded areas cover the 16th to 84th percentiles. Bottom: Bias of the fitted individual cluster masses. For each cluster, we give the median bias and dispersion from the 60 realisations. The dashed lines indicate ±1σ.
Current usage metrics show cumulative count of Article Views (full-text article views including HTML views, PDF and ePub downloads, according to the available data) and Abstracts Views on Vision4Press platform.
Data correspond to usage on the plateform after 2015. The current usage metrics is available 48-96 hours after online publication and is updated daily on week days.
Initial download of the metrics may take a while.