Fig. 2.
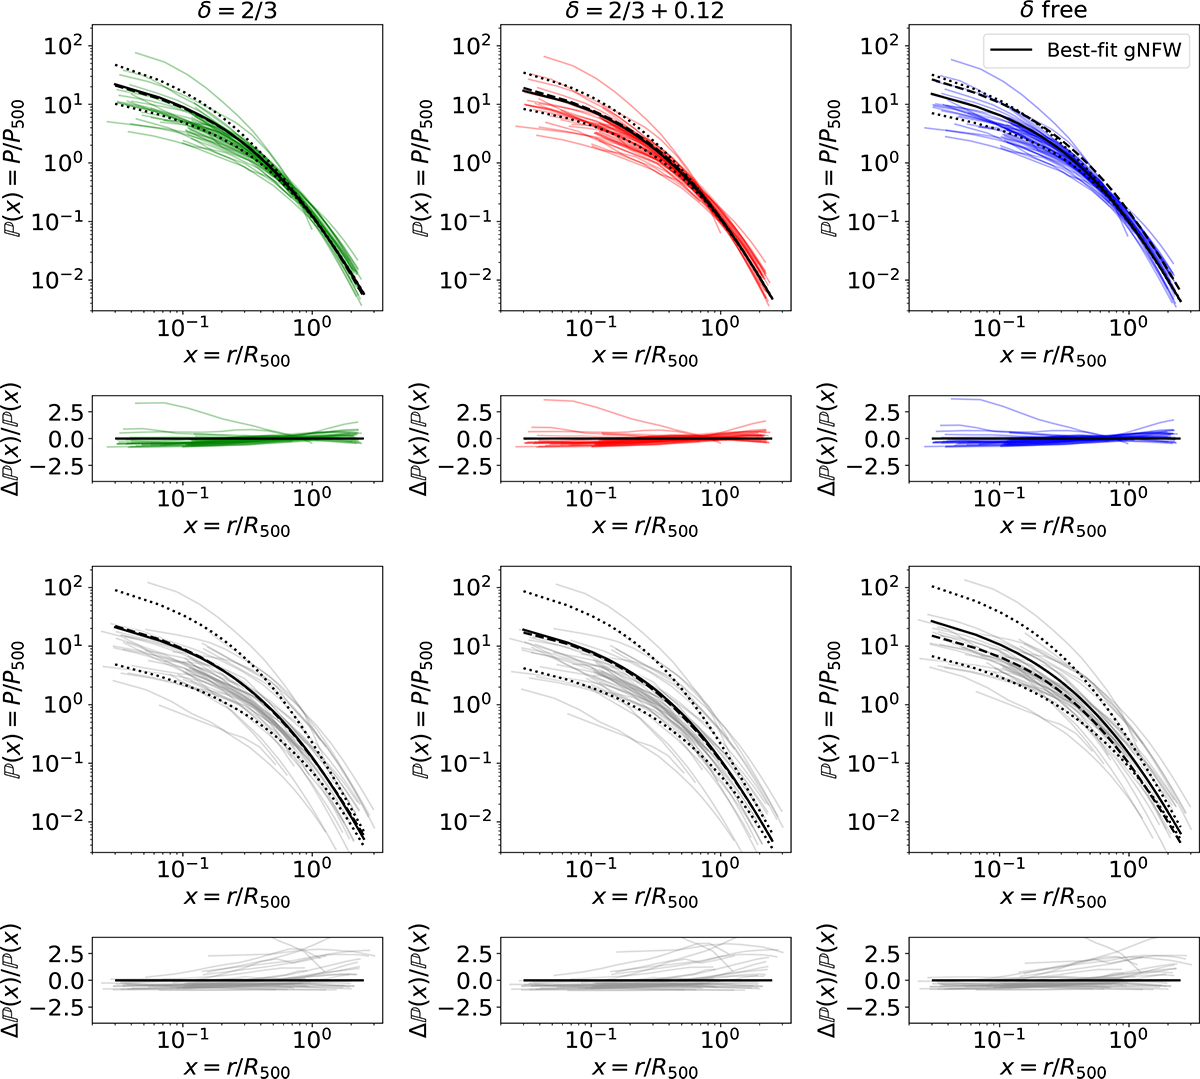
Download original image
Normalised data pressure profiles, best-fit gNFW models, and their relative difference. Top: Coloured profiles show the individual data pressure profiles (from Fig. 1) for the 24 clusters normalised by the best P500, i and R500, i values when fitting the individual masses with dynamical mass estimates as priors. Green, red, and blue correspond to the fits assuming respectively δ = 2/3, δ = 2/3 + 0.12, and δ as a free parameter. Bottom: Data pressure profiles in grey, normalised by P500, i and R500, i values, with masses fixed in the fit and set to the dynamical mass estimates. The solid black profile in each panel indicates the best-fit gNFW profile for that case, with the dotted profiles showing the fitted intrinsic scatter ℙ(x)exp[±σint(x)]. The dashed profiles in the top (bottom) panels correspond to the best-fit gNFW for the mass-fixed (fitted) cases.
Current usage metrics show cumulative count of Article Views (full-text article views including HTML views, PDF and ePub downloads, according to the available data) and Abstracts Views on Vision4Press platform.
Data correspond to usage on the plateform after 2015. The current usage metrics is available 48-96 hours after online publication and is updated daily on week days.
Initial download of the metrics may take a while.