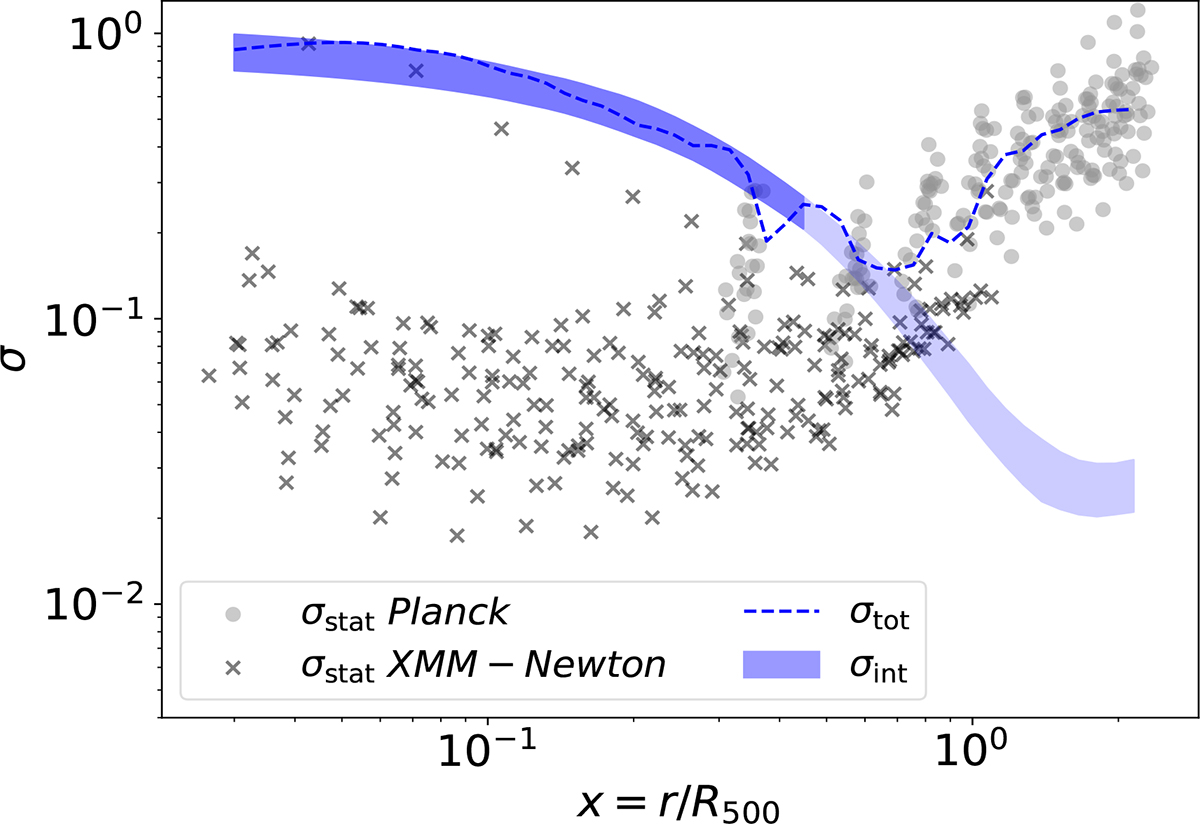
Fig. 4.
Download original image
Scatter of pressure profiles for the 24 clusters in our sample. The shaded area indicates the 16th to 84th percentiles for the intrinsic scatter profile fitted to data pressure profiles (δ free case). The intrinsic scatter may not be reliably constrained beyond x ∼ 0.4. The dashed line indicates the scatter of the individual normalised profiles with respect to the best-fit gNFW model. Statistical uncertainties of the individual pressure profiles are indicated with crosses and circles for the pressure bins corresponding to XMM-Newton and Planck data, respectively. All scatters are given in P500ℙ(x) units.
Current usage metrics show cumulative count of Article Views (full-text article views including HTML views, PDF and ePub downloads, according to the available data) and Abstracts Views on Vision4Press platform.
Data correspond to usage on the plateform after 2015. The current usage metrics is available 48-96 hours after online publication and is updated daily on week days.
Initial download of the metrics may take a while.