Fig. 5.
Download original image
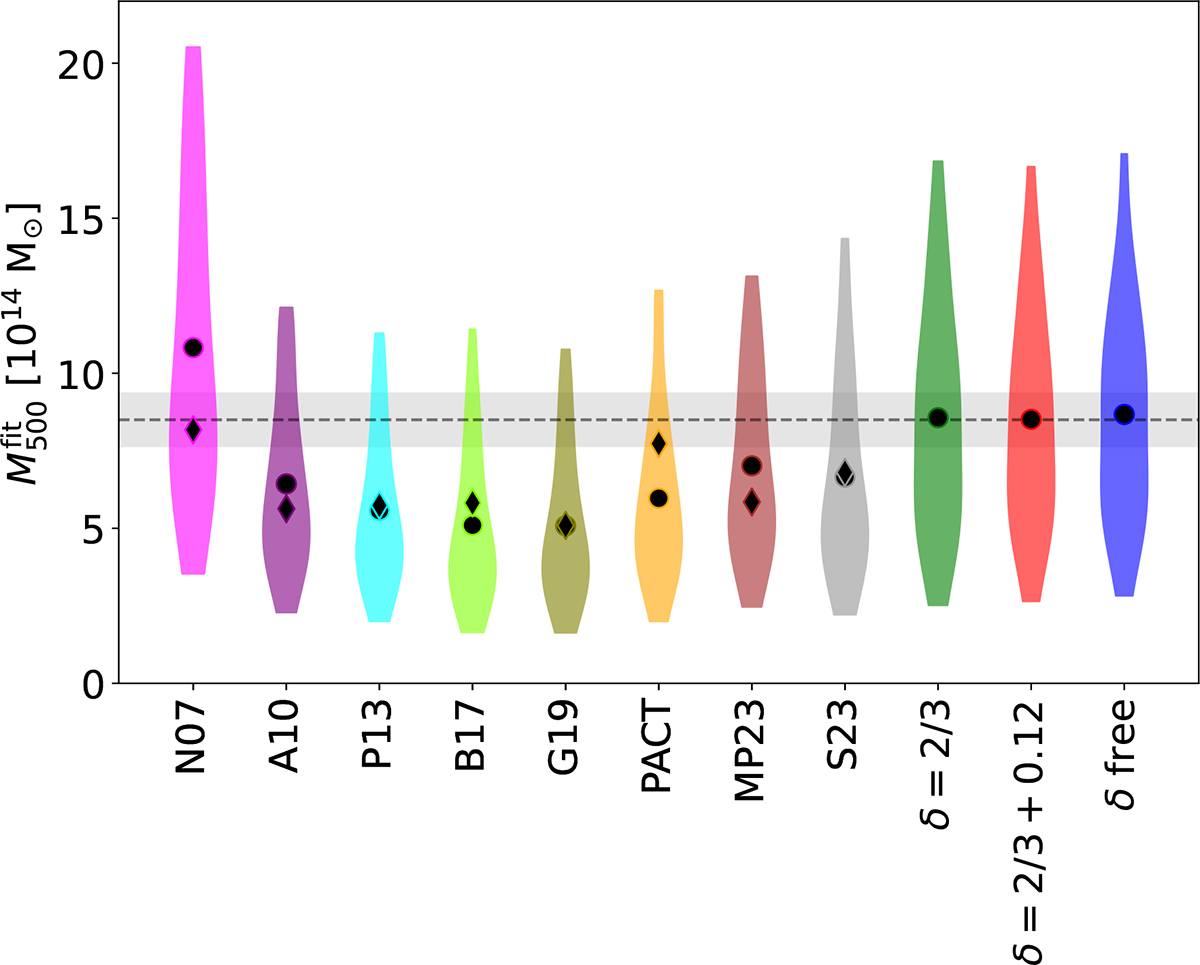
Distribution of the 24 best-fit M500 obtained from the thermal pressure profile fits with ηT free. We present the average mass of the sample for fixed UPPs from the literature, shown with circles and diamonds for the cases where ηT is free in the fit and fixed to ηT = 1.05, respectively. We also show the ![]() distributions and the average masses obtained from the joint fits of the UPP and individual cluster masses, with ηT and σint free in the fits. Different colours indicate results corresponding to the parameters specified in Table E.1 and our three results assuming different δ values. The horizontal dashed line indicates 8.5 × 10¹⁴ M⊙ as a reference, with the shaded area corresponding to a 10% dispersion around this value.
distributions and the average masses obtained from the joint fits of the UPP and individual cluster masses, with ηT and σint free in the fits. Different colours indicate results corresponding to the parameters specified in Table E.1 and our three results assuming different δ values. The horizontal dashed line indicates 8.5 × 10¹⁴ M⊙ as a reference, with the shaded area corresponding to a 10% dispersion around this value.
Current usage metrics show cumulative count of Article Views (full-text article views including HTML views, PDF and ePub downloads, according to the available data) and Abstracts Views on Vision4Press platform.
Data correspond to usage on the plateform after 2015. The current usage metrics is available 48-96 hours after online publication and is updated daily on week days.
Initial download of the metrics may take a while.