Open Access
Fig. A.1.
Download original image
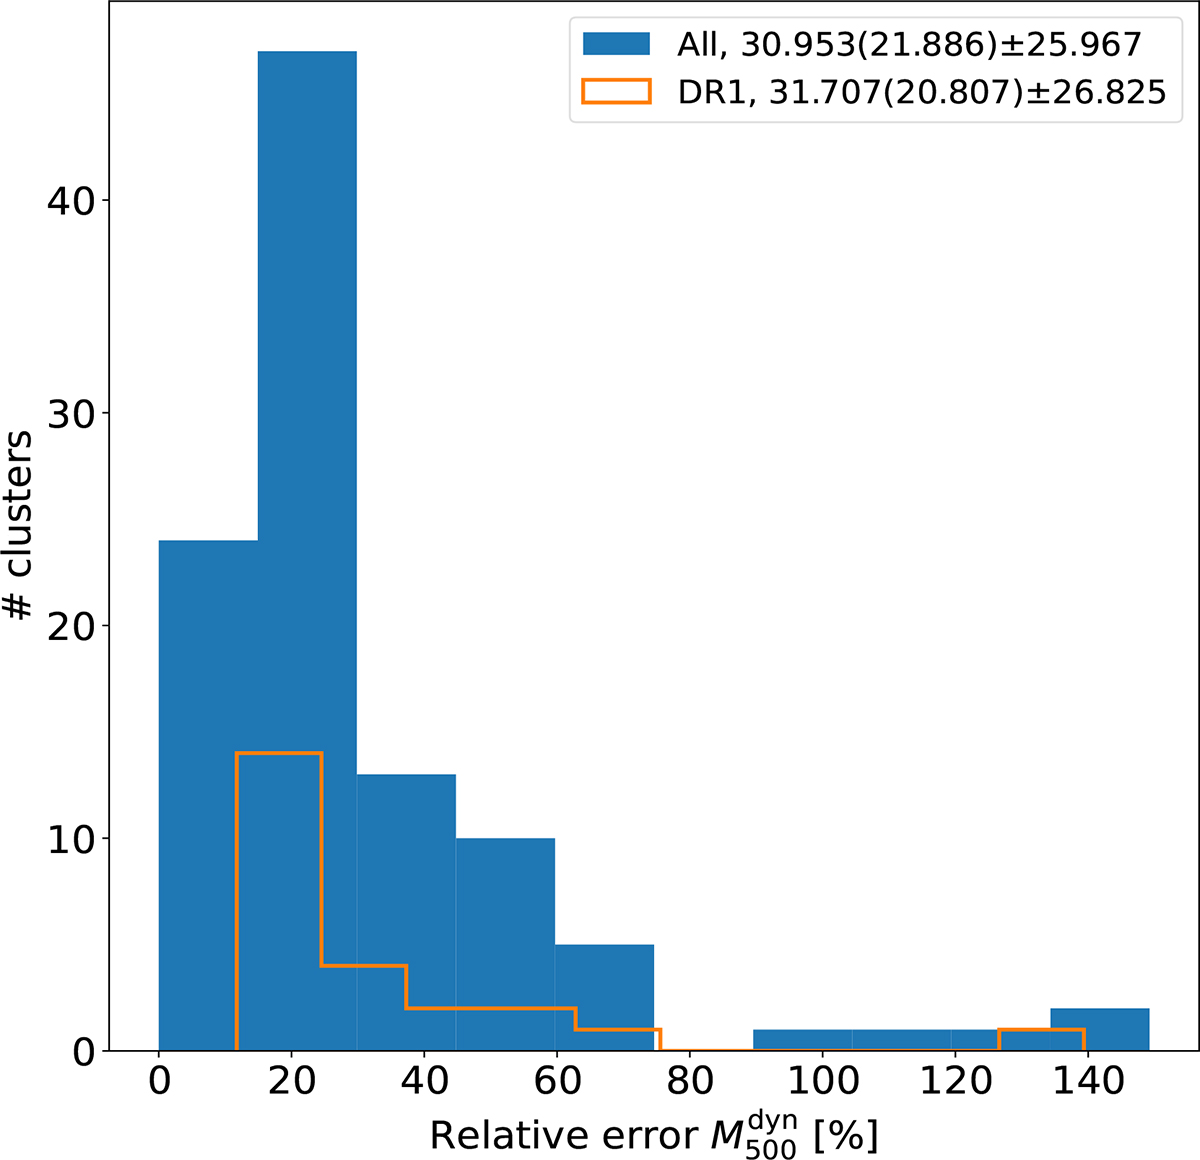
Relative error of individual dynamical mass estimates for the clusters in the CHEX-MATE sample (blue) and the 24 clusters in the DR1 subsample (orange). We provide the mean (median) and standard deviation for each distribution.
Current usage metrics show cumulative count of Article Views (full-text article views including HTML views, PDF and ePub downloads, according to the available data) and Abstracts Views on Vision4Press platform.
Data correspond to usage on the plateform after 2015. The current usage metrics is available 48-96 hours after online publication and is updated daily on week days.
Initial download of the metrics may take a while.