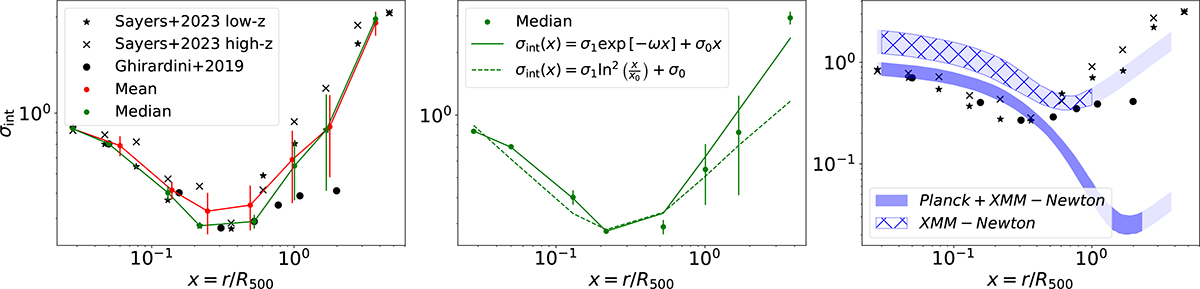
Fig. B.1.
Download original image
Intrinsic scatter profiles of the thermal pressure distribution in galaxy clusters as a function of normalised radius. Left: Scatter measured in Sayers et al. (2023) and Ghirardini et al. (2019) indicated with black markers. The red and green profiles give the mean and median in bins, respectively, with the error bars indicating the standard deviation and the median absolute deviation. Centre: Best-fitting scatter models of the median bins following Eq. (6) (solid) and Eq. (B.1) (dashed). Right: Scatter measured in Sayers et al. (2023) and Ghirardini et al. (2019) shown with black markers as in the left panel. The blue shaded areas indicate the 16th to 84th percentiles of the intrinsic scatter profile fitted following Eq. (6) in the joint fit to our data in Sect. 5.1. We show the result from the fit to Planck and XMM-Newton data as in Fig. 4, and the hatched area corresponds to the XMM-Newton-only fit. Extrapolated regions for each case are shaded.
Current usage metrics show cumulative count of Article Views (full-text article views including HTML views, PDF and ePub downloads, according to the available data) and Abstracts Views on Vision4Press platform.
Data correspond to usage on the plateform after 2015. The current usage metrics is available 48-96 hours after online publication and is updated daily on week days.
Initial download of the metrics may take a while.