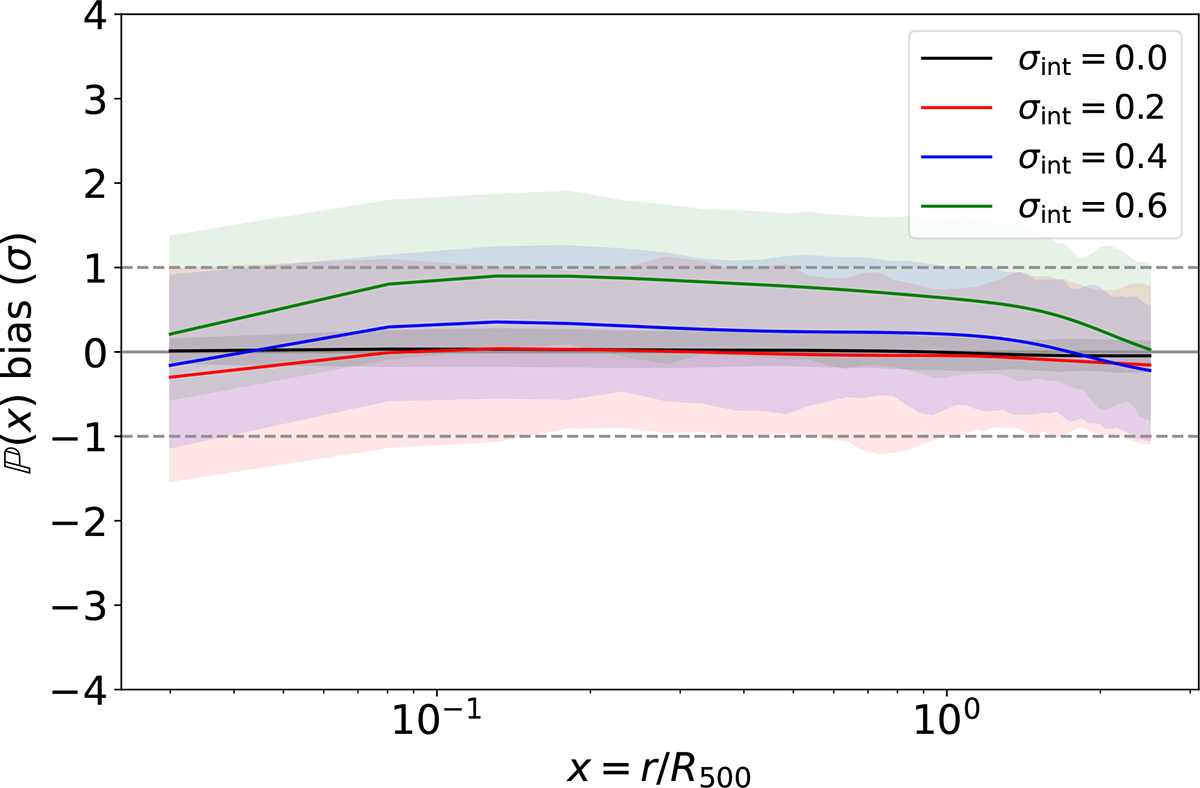
Fig. C.1.
Download original image
Bias of the UPP fitted to mock profiles with intrinsic scatter. Colours indicate the results for the different input intrinsic scatter values. We only show cases with values of 0.0, 0.2, 0.4, and 0.6. The solid lines show the mean bias for the 60 realisations, and the shaded areas cover the 16th to 84th percentiles. The grey dashed lines correspond to ±1σ.
Current usage metrics show cumulative count of Article Views (full-text article views including HTML views, PDF and ePub downloads, according to the available data) and Abstracts Views on Vision4Press platform.
Data correspond to usage on the plateform after 2015. The current usage metrics is available 48-96 hours after online publication and is updated daily on week days.
Initial download of the metrics may take a while.